

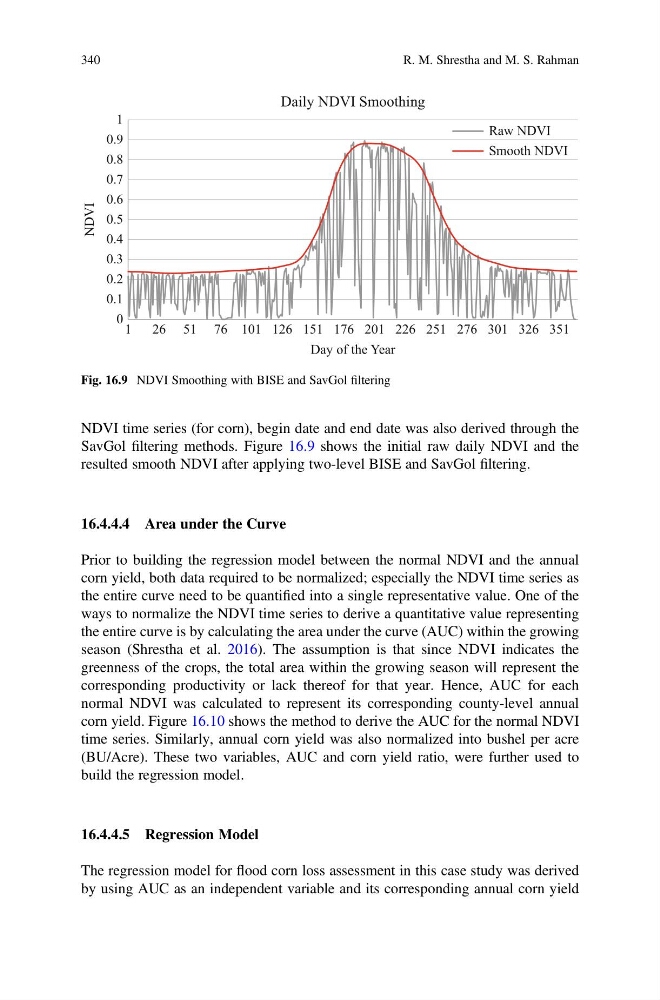
NDVI time series (for corn), begin date and end date was also derived through the
SavGol filtering methods. Figure 16.9 shows the initial raw daily NDVI and the
resulted smooth NDVI after applying two-level BISE and SavGol filtering.
16.4.4.4 Area under the Curve
Prior to building the regression model between the normal NDVI and the annual
corn yield, both data required to be normalized; especially the NDVI time series as
the entire curve need to be quantified into a single representative value. One of the
ways to normalize the NDVI time series to derive a quantitative value representing
the entire curve is by calculating the area under the curve (AUC) within the growing
season (Shrestha et al. 2016). The assumption is that since NDVI indicates the
greenness of the crops, the total area within the growing season will represent the
corresponding productivity or lack thereof for that year. Hence, AUC for each
normal NDVI was calculated to represent its corresponding county-level annual
corn yield. Figure 16.10 shows the method to derive the AUC for the normal NDVI
time series. Similarly, annual corn yield was also normalized into bushel per acre
(BU/Acre). These two variables, AUC and corn yield ratio, were further used to
build the regression model.
16.4.4.5 Regression Model
The regression model for flood corn loss assessment in this case study was derived
by using AUC as an independent variable and its corresponding annual corn yield
0
0.1
0.2
0.3
0.4
0.5
0.6
0.7
0.8
0.9
1
1
26 51 76 101 126 151 176 201 226 251 276 301 326 351
NDVI
Day of the Year
Daily NDVI Smoothing
Raw NDVI
Smooth NDVI
Fig. 16.9 NDVI Smoothing with BISE and SavGol filtering
340
R. M. Shrestha and M. S. Rahman
SavGol filtering methods. Figure 16.9 shows the initial raw daily NDVI and the
resulted smooth NDVI after applying two-level BISE and SavGol filtering.
16.4.4.4 Area under the Curve
Prior to building the regression model between the normal NDVI and the annual
corn yield, both data required to be normalized; especially the NDVI time series as
the entire curve need to be quantified into a single representative value. One of the
ways to normalize the NDVI time series to derive a quantitative value representing
the entire curve is by calculating the area under the curve (AUC) within the growing
season (Shrestha et al. 2016). The assumption is that since NDVI indicates the
greenness of the crops, the total area within the growing season will represent the
corresponding productivity or lack thereof for that year. Hence, AUC for each
normal NDVI was calculated to represent its corresponding county-level annual
corn yield. Figure 16.10 shows the method to derive the AUC for the normal NDVI
time series. Similarly, annual corn yield was also normalized into bushel per acre
(BU/Acre). These two variables, AUC and corn yield ratio, were further used to
build the regression model.
16.4.4.5 Regression Model
The regression model for flood corn loss assessment in this case study was derived
by using AUC as an independent variable and its corresponding annual corn yield
0
0.1
0.2
0.3
0.4
0.5
0.6
0.7
0.8
0.9
1
1
26 51 76 101 126 151 176 201 226 251 276 301 326 351
NDVI
Day of the Year
Daily NDVI Smoothing
Raw NDVI
Smooth NDVI
Fig. 16.9 NDVI Smoothing with BISE and SavGol filtering
340
R. M. Shrestha and M. S. Rahman