

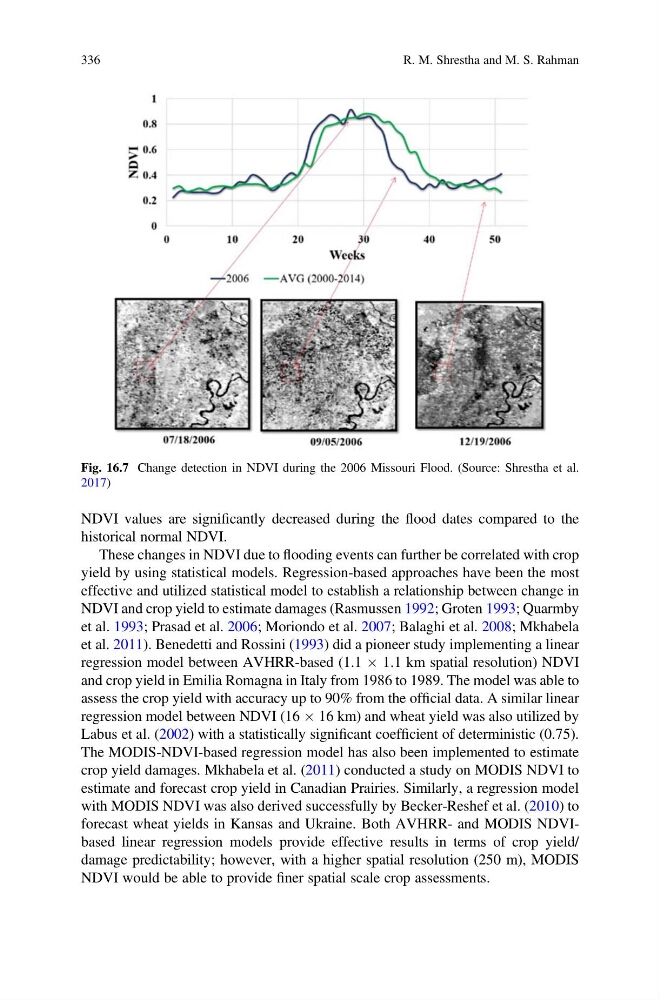
NDVI values are significantly decreased during the flood dates compared to the
historical normal NDVI.
These changes in NDVI due to flooding events can further be correlated with crop
yield by using statistical models. Regression-based approaches have been the most
effective and utilized statistical model to establish a relationship between change in
NDVI and crop yield to estimate damages (Rasmussen 1992; Groten 1993; Quarmby
et al. 1993; Prasad et al. 2006; Moriondo et al. 2007; Balaghi et al. 2008; Mkhabela
et al. 2011). Benedetti and Rossini (1993) did a pioneer study implementing a linear
regression model between AVHRR-based (1.1 Â 1.1 km spatial resolution) NDVI
and crop yield in Emilia Romagna in Italy from 1986 to 1989. The model was able to
assess the crop yield with accuracy up to 90% from the official data. A similar linear
regression model between NDVI (16 Â 16 km) and wheat yield was also utilized by
Labus et al. (2002) with a statistically significant coefficient of deterministic (0.75).
The MODIS-NDVI-based regression model has also been implemented to estimate
crop yield damages. Mkhabela et al. (2011) conducted a study on MODIS NDVI to
estimate and forecast crop yield in Canadian Prairies. Similarly, a regression model
with MODIS NDVI was also derived successfully by Becker-Reshef et al. (2010) to
forecast wheat yields in Kansas and Ukraine. Both AVHRR- and MODIS NDVIbased linear regression models provide effective results in terms of crop yield/
damage predictability; however, with a higher spatial resolution (250 m), MODIS
NDVI would be able to provide finer spatial scale crop assessments.
Fig. 16.7 Change detection in NDVI during the 2006 Missouri Flood. (Source: Shrestha et al.
2017)
336
R. M. Shrestha and M. S. Rahman
historical normal NDVI.
These changes in NDVI due to flooding events can further be correlated with crop
yield by using statistical models. Regression-based approaches have been the most
effective and utilized statistical model to establish a relationship between change in
NDVI and crop yield to estimate damages (Rasmussen 1992; Groten 1993; Quarmby
et al. 1993; Prasad et al. 2006; Moriondo et al. 2007; Balaghi et al. 2008; Mkhabela
et al. 2011). Benedetti and Rossini (1993) did a pioneer study implementing a linear
regression model between AVHRR-based (1.1 Â 1.1 km spatial resolution) NDVI
and crop yield in Emilia Romagna in Italy from 1986 to 1989. The model was able to
assess the crop yield with accuracy up to 90% from the official data. A similar linear
regression model between NDVI (16 Â 16 km) and wheat yield was also utilized by
Labus et al. (2002) with a statistically significant coefficient of deterministic (0.75).
The MODIS-NDVI-based regression model has also been implemented to estimate
crop yield damages. Mkhabela et al. (2011) conducted a study on MODIS NDVI to
estimate and forecast crop yield in Canadian Prairies. Similarly, a regression model
with MODIS NDVI was also derived successfully by Becker-Reshef et al. (2010) to
forecast wheat yields in Kansas and Ukraine. Both AVHRR- and MODIS NDVIbased linear regression models provide effective results in terms of crop yield/
damage predictability; however, with a higher spatial resolution (250 m), MODIS
NDVI would be able to provide finer spatial scale crop assessments.
Fig. 16.7 Change detection in NDVI during the 2006 Missouri Flood. (Source: Shrestha et al.
2017)
336
R. M. Shrestha and M. S. Rahman