

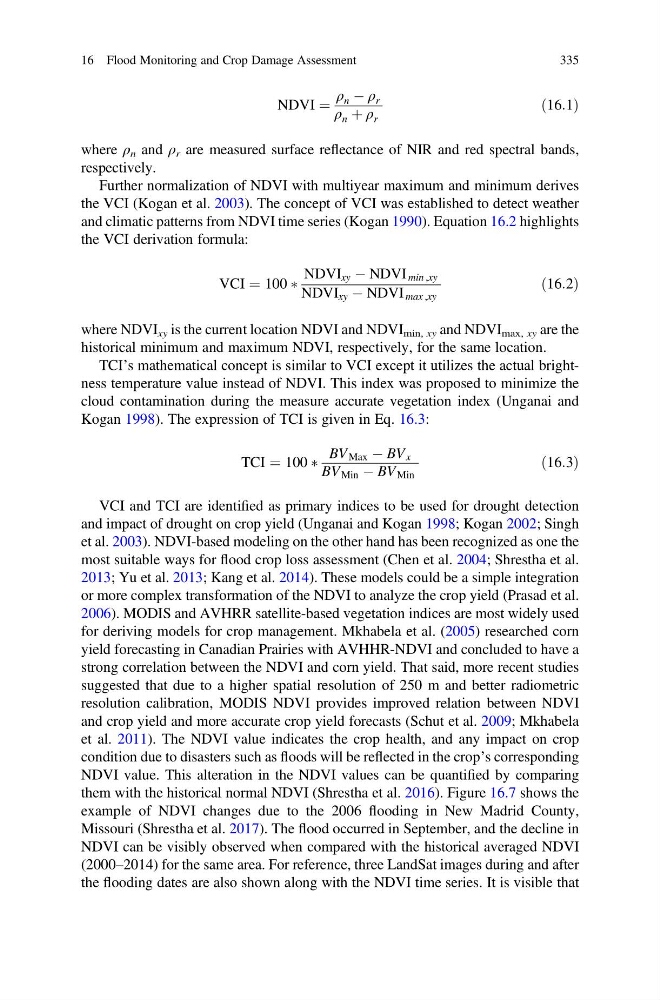
NDVI ¼
ρ n À ρ r
ρ n þ ρ r
ð16:1Þ
where ρ n and ρ r are measured surface reflectance of NIR and red spectral bands,
respectively.
Further normalization of NDVI with multiyear maximum and minimum derives
the VCI (Kogan et al. 2003). The concept of VCI was established to detect weather
and climatic patterns from NDVI time series (Kogan 1990). Equation 16.2 highlights
the VCI derivation formula:
VCI ¼ 100 Ã
NDVI xy À NDVI min ,xy
NDVI xy À NDVI max ,xy
ð16:2Þ
where NDVI xy is the current location NDVI and NDVI min, xy and NDVI max, xy are the
historical minimum and maximum NDVI, respectively, for the same location.
TCI’s mathematical concept is similar to VCI except it utilizes the actual brightness temperature value instead of NDVI. This index was proposed to minimize the
cloud contamination during the measure accurate vegetation index (Unganai and
Kogan 1998). The expression of TCI is given in Eq. 16.3:
TCI ¼ 100 Ã
BV Max À BV x
BV Min À BV Min
ð16:3Þ
VCI and TCI are identified as primary indices to be used for drought detection
and impact of drought on crop yield (Unganai and Kogan 1998; Kogan 2002; Singh
et al. 2003). NDVI-based modeling on the other hand has been recognized as one the
most suitable ways for flood crop loss assessment (Chen et al. 2004; Shrestha et al.
2013; Yu et al. 2013; Kang et al. 2014). These models could be a simple integration
or more complex transformation of the NDVI to analyze the crop yield (Prasad et al.
2006). MODIS and AVHRR satellite-based vegetation indices are most widely used
for deriving models for crop management. Mkhabela et al. (2005) researched corn
yield forecasting in Canadian Prairies with AVHHR-NDVI and concluded to have a
strong correlation between the NDVI and corn yield. That said, more recent studies
suggested that due to a higher spatial resolution of 250 m and better radiometric
resolution calibration, MODIS NDVI provides improved relation between NDVI
and crop yield and more accurate crop yield forecasts (Schut et al. 2009; Mkhabela
et al. 2011). The NDVI value indicates the crop health, and any impact on crop
condition due to disasters such as floods will be reflected in the crop’s corresponding
NDVI value. This alteration in the NDVI values can be quantified by comparing
them with the historical normal NDVI (Shrestha et al. 2016). Figure 16.7 shows the
example of NDVI changes due to the 2006 flooding in New Madrid County,
Missouri (Shrestha et al. 2017). The flood occurred in September, and the decline in
NDVI can be visibly observed when compared with the historical averaged NDVI
(2000–2014) for the same area. For reference, three LandSat images during and after
the flooding dates are also shown along with the NDVI time series. It is visible that
16 Flood Monitoring and Crop Damage Assessment
335
ρ n À ρ r
ρ n þ ρ r
ð16:1Þ
where ρ n and ρ r are measured surface reflectance of NIR and red spectral bands,
respectively.
Further normalization of NDVI with multiyear maximum and minimum derives
the VCI (Kogan et al. 2003). The concept of VCI was established to detect weather
and climatic patterns from NDVI time series (Kogan 1990). Equation 16.2 highlights
the VCI derivation formula:
VCI ¼ 100 Ã
NDVI xy À NDVI min ,xy
NDVI xy À NDVI max ,xy
ð16:2Þ
where NDVI xy is the current location NDVI and NDVI min, xy and NDVI max, xy are the
historical minimum and maximum NDVI, respectively, for the same location.
TCI’s mathematical concept is similar to VCI except it utilizes the actual brightness temperature value instead of NDVI. This index was proposed to minimize the
cloud contamination during the measure accurate vegetation index (Unganai and
Kogan 1998). The expression of TCI is given in Eq. 16.3:
TCI ¼ 100 Ã
BV Max À BV x
BV Min À BV Min
ð16:3Þ
VCI and TCI are identified as primary indices to be used for drought detection
and impact of drought on crop yield (Unganai and Kogan 1998; Kogan 2002; Singh
et al. 2003). NDVI-based modeling on the other hand has been recognized as one the
most suitable ways for flood crop loss assessment (Chen et al. 2004; Shrestha et al.
2013; Yu et al. 2013; Kang et al. 2014). These models could be a simple integration
or more complex transformation of the NDVI to analyze the crop yield (Prasad et al.
2006). MODIS and AVHRR satellite-based vegetation indices are most widely used
for deriving models for crop management. Mkhabela et al. (2005) researched corn
yield forecasting in Canadian Prairies with AVHHR-NDVI and concluded to have a
strong correlation between the NDVI and corn yield. That said, more recent studies
suggested that due to a higher spatial resolution of 250 m and better radiometric
resolution calibration, MODIS NDVI provides improved relation between NDVI
and crop yield and more accurate crop yield forecasts (Schut et al. 2009; Mkhabela
et al. 2011). The NDVI value indicates the crop health, and any impact on crop
condition due to disasters such as floods will be reflected in the crop’s corresponding
NDVI value. This alteration in the NDVI values can be quantified by comparing
them with the historical normal NDVI (Shrestha et al. 2016). Figure 16.7 shows the
example of NDVI changes due to the 2006 flooding in New Madrid County,
Missouri (Shrestha et al. 2017). The flood occurred in September, and the decline in
NDVI can be visibly observed when compared with the historical averaged NDVI
(2000–2014) for the same area. For reference, three LandSat images during and after
the flooding dates are also shown along with the NDVI time series. It is visible that
16 Flood Monitoring and Crop Damage Assessment
335