

except that on some days, Terra-based EF mainly overestimated (EF % 1) observed
EF at US-Skr (Fig. 15.6a). Overall, more accurate results were achieved when the
model is run with MODIS-T s products acquired by the Aqua satellite. That is
because the Aqua satellite passes over the site around 13:30 in the afternoon when
the evaporative demand is highest and T s -T a is a better indicator of the daytime EF
and ET (Jackson et al. 1983), whereas Terra overpass is around 10:45 in the
morning. Both satellite estimates were negatively biased and root mean square errors
(RMSE) were 0.142 and 0.109 for the Terra- and Aqua-based EF, respectively.
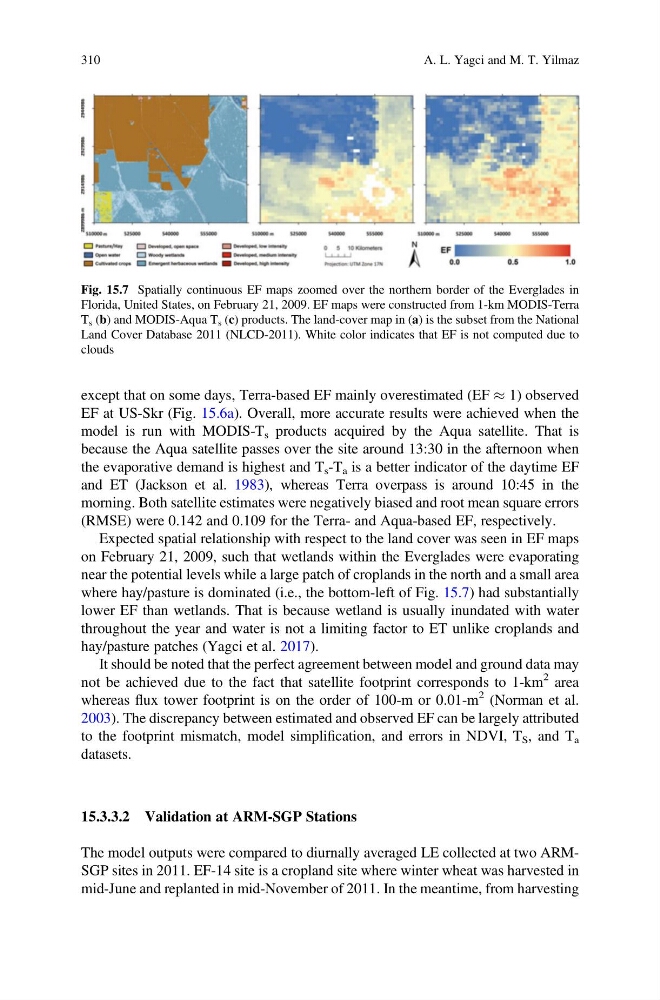
Expected spatial relationship with respect to the land cover was seen in EF maps
on February 21, 2009, such that wetlands within the Everglades were evaporating
near the potential levels while a large patch of croplands in the north and a small area
where hay/pasture is dominated (i.e., the bottom-left of Fig. 15.7) had substantially
lower EF than wetlands. That is because wetland is usually inundated with water
throughout the year and water is not a limiting factor to ET unlike croplands and
hay/pasture patches (Yagci et al. 2017).
It should be noted that the perfect agreement between model and ground data may
not be achieved due to the fact that satellite footprint corresponds to 1-km
2 area
whereas flux tower footprint is on the order of 100-m or 0.01-m
2 (Norman et al.
2003). The discrepancy between estimated and observed EF can be largely attributed
to the footprint mismatch, model simplification, and errors in NDVI, T S , and T a
datasets.
15.3.3.2 Validation at ARM-SGP Stations
The model outputs were compared to diurnally averaged LE collected at two ARMSGP sites in 2011. EF-14 site is a cropland site where winter wheat was harvested in
mid-June and replanted in mid-November of 2011. In the meantime, from harvesting
Fig. 15.7 Spatially continuous EF maps zoomed over the northern border of the Everglades in
Florida, United States, on February 21, 2009. EF maps were constructed from 1-km MODIS-Terra
T s (b) and MODIS-Aqua T s (c) products. The land-cover map in (a) is the subset from the National
Land Cover Database 2011 (NLCD-2011). White color indicates that EF is not computed due to
clouds
310
A. L. Yagci and M. T. Yilmaz
EF at US-Skr (Fig. 15.6a). Overall, more accurate results were achieved when the
model is run with MODIS-T s products acquired by the Aqua satellite. That is
because the Aqua satellite passes over the site around 13:30 in the afternoon when
the evaporative demand is highest and T s -T a is a better indicator of the daytime EF
and ET (Jackson et al. 1983), whereas Terra overpass is around 10:45 in the
morning. Both satellite estimates were negatively biased and root mean square errors
(RMSE) were 0.142 and 0.109 for the Terra- and Aqua-based EF, respectively.
Expected spatial relationship with respect to the land cover was seen in EF maps
on February 21, 2009, such that wetlands within the Everglades were evaporating
near the potential levels while a large patch of croplands in the north and a small area
where hay/pasture is dominated (i.e., the bottom-left of Fig. 15.7) had substantially
lower EF than wetlands. That is because wetland is usually inundated with water
throughout the year and water is not a limiting factor to ET unlike croplands and
hay/pasture patches (Yagci et al. 2017).
It should be noted that the perfect agreement between model and ground data may
not be achieved due to the fact that satellite footprint corresponds to 1-km
2 area
whereas flux tower footprint is on the order of 100-m or 0.01-m
2 (Norman et al.
2003). The discrepancy between estimated and observed EF can be largely attributed
to the footprint mismatch, model simplification, and errors in NDVI, T S , and T a
datasets.
15.3.3.2 Validation at ARM-SGP Stations
The model outputs were compared to diurnally averaged LE collected at two ARMSGP sites in 2011. EF-14 site is a cropland site where winter wheat was harvested in
mid-June and replanted in mid-November of 2011. In the meantime, from harvesting
Fig. 15.7 Spatially continuous EF maps zoomed over the northern border of the Everglades in
Florida, United States, on February 21, 2009. EF maps were constructed from 1-km MODIS-Terra
T s (b) and MODIS-Aqua T s (c) products. The land-cover map in (a) is the subset from the National
Land Cover Database 2011 (NLCD-2011). White color indicates that EF is not computed due to
clouds
310
A. L. Yagci and M. T. Yilmaz