

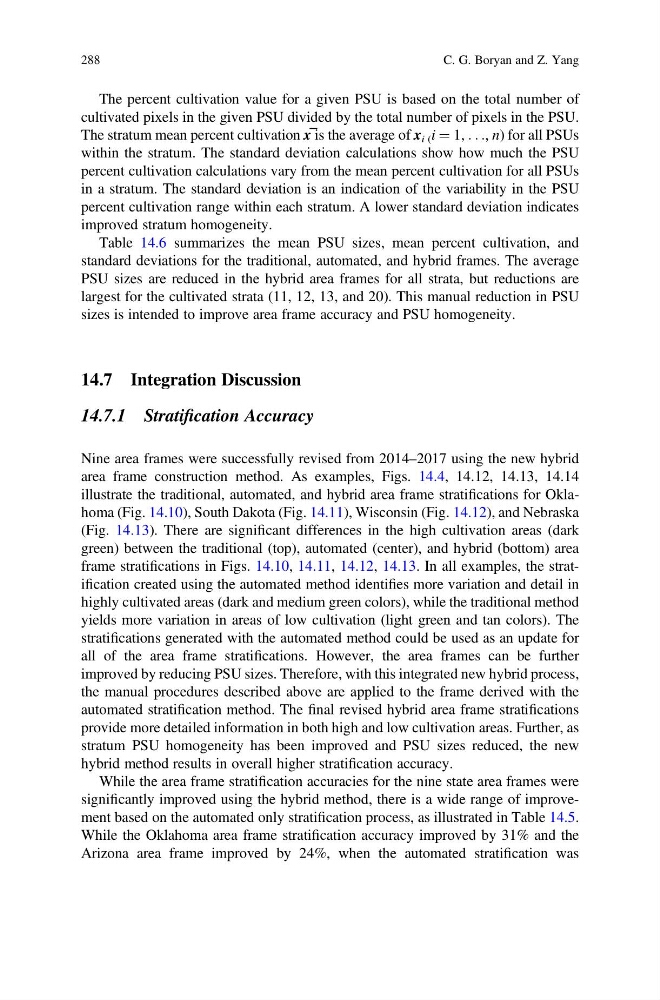
The percent cultivation value for a given PSU is based on the total number of
cultivated pixels in the given PSU divided by the total number of pixels in the PSU.
The stratum mean percent cultivation x is the average of x i ( i ¼ 1, . . ., n) for all PSUs
within the stratum. The standard deviation calculations show how much the PSU
percent cultivation calculations vary from the mean percent cultivation for all PSUs
in a stratum. The standard deviation is an indication of the variability in the PSU
percent cultivation range within each stratum. A lower standard deviation indicates
improved stratum homogeneity.
Table 14.6 summarizes the mean PSU sizes, mean percent cultivation, and
standard deviations for the traditional, automated, and hybrid frames. The average
PSU sizes are reduced in the hybrid area frames for all strata, but reductions are
largest for the cultivated strata (11, 12, 13, and 20). This manual reduction in PSU
sizes is intended to improve area frame accuracy and PSU homogeneity.
14.7 Integration Discussion
14.7.1 Stratification Accuracy
Nine area frames were successfully revised from 2014–2017 using the new hybrid
area frame construction method. As examples, Figs. 14.4, 14.12, 14.13, 14.14
illustrate the traditional, automated, and hybrid area frame stratifications for Oklahoma (Fig. 14.10), South Dakota (Fig. 14.11), Wisconsin (Fig. 14.12), and Nebraska
(Fig. 14.13). There are significant differences in the high cultivation areas (dark
green) between the traditional (top), automated (center), and hybrid (bottom) area
frame stratifications in Figs. 14.10, 14.11, 14.12, 14.13. In all examples, the stratification created using the automated method identifies more variation and detail in
highly cultivated areas (dark and medium green colors), while the traditional method
yields more variation in areas of low cultivation (light green and tan colors). The
stratifications generated with the automated method could be used as an update for
all of the area frame stratifications. However, the area frames can be further
improved by reducing PSU sizes. Therefore, with this integrated new hybrid process,
the manual procedures described above are applied to the frame derived with the
automated stratification method. The final revised hybrid area frame stratifications
provide more detailed information in both high and low cultivation areas. Further, as
stratum PSU homogeneity has been improved and PSU sizes reduced, the new
hybrid method results in overall higher stratification accuracy.
While the area frame stratification accuracies for the nine state area frames were
significantly improved using the hybrid method, there is a wide range of improvement based on the automated only stratification process, as illustrated in Table 14.5.
While the Oklahoma area frame stratification accuracy improved by 31% and the
Arizona area frame improved by 24%, when the automated stratification was
288
C. G. Boryan and Z. Yang
cultivated pixels in the given PSU divided by the total number of pixels in the PSU.
The stratum mean percent cultivation x is the average of x i ( i ¼ 1, . . ., n) for all PSUs
within the stratum. The standard deviation calculations show how much the PSU
percent cultivation calculations vary from the mean percent cultivation for all PSUs
in a stratum. The standard deviation is an indication of the variability in the PSU
percent cultivation range within each stratum. A lower standard deviation indicates
improved stratum homogeneity.
Table 14.6 summarizes the mean PSU sizes, mean percent cultivation, and
standard deviations for the traditional, automated, and hybrid frames. The average
PSU sizes are reduced in the hybrid area frames for all strata, but reductions are
largest for the cultivated strata (11, 12, 13, and 20). This manual reduction in PSU
sizes is intended to improve area frame accuracy and PSU homogeneity.
14.7 Integration Discussion
14.7.1 Stratification Accuracy
Nine area frames were successfully revised from 2014–2017 using the new hybrid
area frame construction method. As examples, Figs. 14.4, 14.12, 14.13, 14.14
illustrate the traditional, automated, and hybrid area frame stratifications for Oklahoma (Fig. 14.10), South Dakota (Fig. 14.11), Wisconsin (Fig. 14.12), and Nebraska
(Fig. 14.13). There are significant differences in the high cultivation areas (dark
green) between the traditional (top), automated (center), and hybrid (bottom) area
frame stratifications in Figs. 14.10, 14.11, 14.12, 14.13. In all examples, the stratification created using the automated method identifies more variation and detail in
highly cultivated areas (dark and medium green colors), while the traditional method
yields more variation in areas of low cultivation (light green and tan colors). The
stratifications generated with the automated method could be used as an update for
all of the area frame stratifications. However, the area frames can be further
improved by reducing PSU sizes. Therefore, with this integrated new hybrid process,
the manual procedures described above are applied to the frame derived with the
automated stratification method. The final revised hybrid area frame stratifications
provide more detailed information in both high and low cultivation areas. Further, as
stratum PSU homogeneity has been improved and PSU sizes reduced, the new
hybrid method results in overall higher stratification accuracy.
While the area frame stratification accuracies for the nine state area frames were
significantly improved using the hybrid method, there is a wide range of improvement based on the automated only stratification process, as illustrated in Table 14.5.
While the Oklahoma area frame stratification accuracy improved by 31% and the
Arizona area frame improved by 24%, when the automated stratification was
288
C. G. Boryan and Z. Yang