

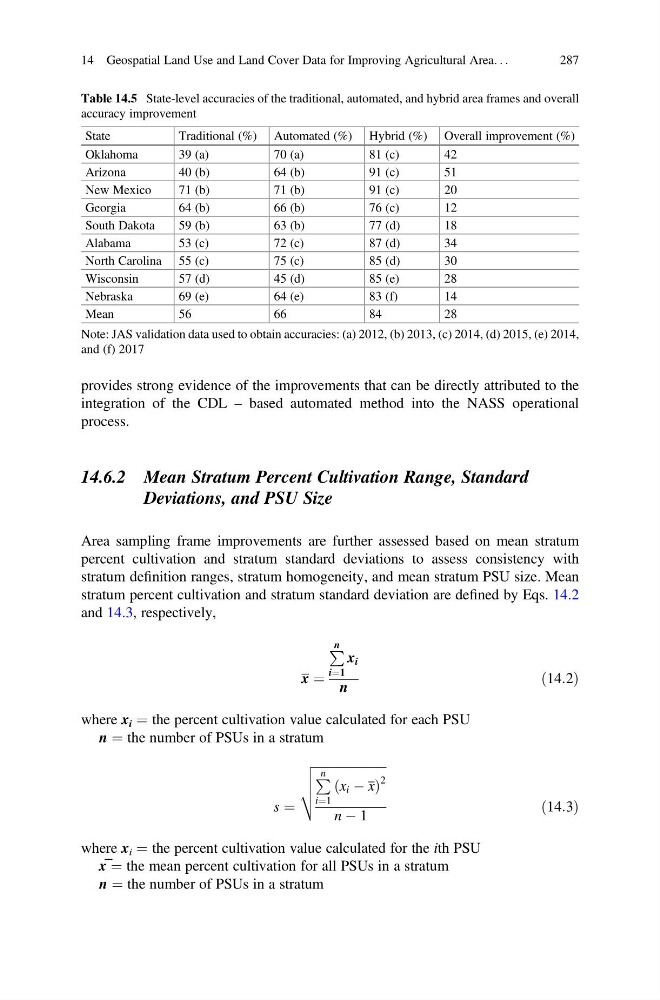
provides strong evidence of the improvements that can be directly attributed to the
integration of the CDL – based automated method into the NASS operational
process.
14.6.2 Mean Stratum Percent Cultivation Range, Standard
Deviations, and PSU Size
Area sampling frame improvements are further assessed based on mean stratum
percent cultivation and stratum standard deviations to assess consistency with
stratum definition ranges, stratum homogeneity, and mean stratum PSU size. Mean
stratum percent cultivation and stratum standard deviation are defined by Eqs. 14.2
and 14.3, respectively,
x ¼
P n
i¼1
x i
n
ð14:2Þ
where x i ¼ the percent cultivation value calculated for each PSU
n ¼ the number of PSUs in a stratum
s ¼
ffiffiffiffiffiffiffiffiffiffiffiffiffiffiffiffiffiffiffiffiffiffiffi
P n
i¼1
x i À x
ð
Þ
2
n À 1
v
u
u
t
ð14:3Þ
where x i ¼ the percent cultivation value calculated for the ith PSU
x ¼ the mean percent cultivation for all PSUs in a stratum
n ¼ the number of PSUs in a stratum
Table 14.5 State-level accuracies of the traditional, automated, and hybrid area frames and overall
accuracy improvement
State
Traditional (%) Automated (%) Hybrid (%) Overall improvement (%)
Oklahoma
39 (a)
70 (a)
81 (c)
42
Arizona
40 (b)
64 (b)
91 (c)
51
New Mexico
71 (b)
71 (b)
91 (c)
20
Georgia
64 (b)
66 (b)
76 (c)
12
South Dakota
59 (b)
63 (b)
77 (d)
18
Alabama
53 (c)
72 (c)
87 (d)
34
North Carolina 55 (c)
75 (c)
85 (d)
30
Wisconsin
57 (d)
45 (d)
85 (e)
28
Nebraska
69 (e)
64 (e)
83 (f)
14
Mean
56
66
84
28
Note: JAS validation data used to obtain accuracies: (a) 2012, (b) 2013, (c) 2014, (d) 2015, (e) 2014,
and (f) 2017
14 Geospatial Land Use and Land Cover Data for Improving Agricultural Area. . .
287
integration of the CDL – based automated method into the NASS operational
process.
14.6.2 Mean Stratum Percent Cultivation Range, Standard
Deviations, and PSU Size
Area sampling frame improvements are further assessed based on mean stratum
percent cultivation and stratum standard deviations to assess consistency with
stratum definition ranges, stratum homogeneity, and mean stratum PSU size. Mean
stratum percent cultivation and stratum standard deviation are defined by Eqs. 14.2
and 14.3, respectively,
x ¼
P n
i¼1
x i
n
ð14:2Þ
where x i ¼ the percent cultivation value calculated for each PSU
n ¼ the number of PSUs in a stratum
s ¼
ffiffiffiffiffiffiffiffiffiffiffiffiffiffiffiffiffiffiffiffiffiffiffi
P n
i¼1
x i À x
ð
Þ
2
n À 1
v
u
u
t
ð14:3Þ
where x i ¼ the percent cultivation value calculated for the ith PSU
x ¼ the mean percent cultivation for all PSUs in a stratum
n ¼ the number of PSUs in a stratum
Table 14.5 State-level accuracies of the traditional, automated, and hybrid area frames and overall
accuracy improvement
State
Traditional (%) Automated (%) Hybrid (%) Overall improvement (%)
Oklahoma
39 (a)
70 (a)
81 (c)
42
Arizona
40 (b)
64 (b)
91 (c)
51
New Mexico
71 (b)
71 (b)
91 (c)
20
Georgia
64 (b)
66 (b)
76 (c)
12
South Dakota
59 (b)
63 (b)
77 (d)
18
Alabama
53 (c)
72 (c)
87 (d)
34
North Carolina 55 (c)
75 (c)
85 (d)
30
Wisconsin
57 (d)
45 (d)
85 (e)
28
Nebraska
69 (e)
64 (e)
83 (f)
14
Mean
56
66
84
28
Note: JAS validation data used to obtain accuracies: (a) 2012, (b) 2013, (c) 2014, (d) 2015, (e) 2014,
and (f) 2017
14 Geospatial Land Use and Land Cover Data for Improving Agricultural Area. . .
287