

quality control were passed to the aircraft crews and re-flights were conducted if
needed. After the final quality control (QC) acceptance, the images were merged into
aerial triangulation (AT) blocks.
A total of 189,897 Level 02 images were processed, with an average number of
3491 images per block.
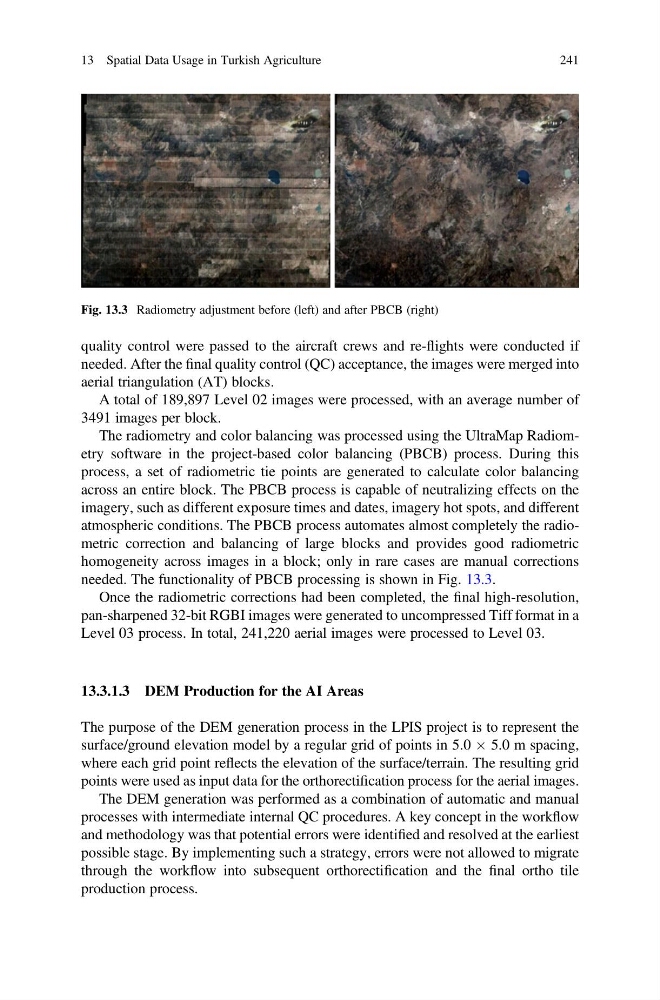
The radiometry and color balancing was processed using the UltraMap Radiometry software in the project-based color balancing (PBCB) process. During this
process, a set of radiometric tie points are generated to calculate color balancing
across an entire block. The PBCB process is capable of neutralizing effects on the
imagery, such as different exposure times and dates, imagery hot spots, and different
atmospheric conditions. The PBCB process automates almost completely the radiometric correction and balancing of large blocks and provides good radiometric
homogeneity across images in a block; only in rare cases are manual corrections
needed. The functionality of PBCB processing is shown in Fig. 13.3.
Once the radiometric corrections had been completed, the final high-resolution,
pan-sharpened 32-bit RGBI images were generated to uncompressed Tiff format in a
Level 03 process. In total, 241,220 aerial images were processed to Level 03.
13.3.1.3 DEM Production for the AI Areas
The purpose of the DEM generation process in the LPIS project is to represent the
surface/ground elevation model by a regular grid of points in 5.0 Â 5.0 m spacing,
where each grid point reflects the elevation of the surface/terrain. The resulting grid
points were used as input data for the orthorectification process for the aerial images.
The DEM generation was performed as a combination of automatic and manual
processes with intermediate internal QC procedures. A key concept in the workflow
and methodology was that potential errors were identified and resolved at the earliest
possible stage. By implementing such a strategy, errors were not allowed to migrate
through the workflow into subsequent orthorectification and the final ortho tile
production process.
Fig. 13.3 Radiometry adjustment before (left) and after PBCB (right)
13 Spatial Data Usage in Turkish Agriculture
241
needed. After the final quality control (QC) acceptance, the images were merged into
aerial triangulation (AT) blocks.
A total of 189,897 Level 02 images were processed, with an average number of
3491 images per block.
The radiometry and color balancing was processed using the UltraMap Radiometry software in the project-based color balancing (PBCB) process. During this
process, a set of radiometric tie points are generated to calculate color balancing
across an entire block. The PBCB process is capable of neutralizing effects on the
imagery, such as different exposure times and dates, imagery hot spots, and different
atmospheric conditions. The PBCB process automates almost completely the radiometric correction and balancing of large blocks and provides good radiometric
homogeneity across images in a block; only in rare cases are manual corrections
needed. The functionality of PBCB processing is shown in Fig. 13.3.
Once the radiometric corrections had been completed, the final high-resolution,
pan-sharpened 32-bit RGBI images were generated to uncompressed Tiff format in a
Level 03 process. In total, 241,220 aerial images were processed to Level 03.
13.3.1.3 DEM Production for the AI Areas
The purpose of the DEM generation process in the LPIS project is to represent the
surface/ground elevation model by a regular grid of points in 5.0 Â 5.0 m spacing,
where each grid point reflects the elevation of the surface/terrain. The resulting grid
points were used as input data for the orthorectification process for the aerial images.
The DEM generation was performed as a combination of automatic and manual
processes with intermediate internal QC procedures. A key concept in the workflow
and methodology was that potential errors were identified and resolved at the earliest
possible stage. By implementing such a strategy, errors were not allowed to migrate
through the workflow into subsequent orthorectification and the final ortho tile
production process.
Fig. 13.3 Radiometry adjustment before (left) and after PBCB (right)
13 Spatial Data Usage in Turkish Agriculture
241