

11.4 Remote Sensing Monitoring of Crop Growth
Remote sensing has been proved as an effective method for monitoring crop growth
and forecasting yield. The advantages of remote sensing–based methods over
traditional crop models include their spatial coverage, spectral information, and
availability of free multisource data during the growing season. Most of the research
on remote sensing for crop growth monitoring mainly uses visible and near-infrared
data. Since these satellite data can describe the crop growth state and biomass
seasonal dynamics. However, cloud cover and rainfall conditions may affect the
usability of these data. Using microwave data overcomes some problems of the
above remotely sensed data gaps during the growing season. Optical and microwave
remote sensing data are often used together for crop growth monitoring.
Spectral indices and quantitative remote sensing are the main two methods for
crop growth monitoring. Spectral indices are the mathematical combinations of the
reflectance of the relevant spectral bands. Numerous efforts have been made to
develop various indices using remote sensing data such as NDVI, EVI, SAVI, and
TVDI. Many researchers use these spectral indices for crop growth monitoring and
yield forecasting by developing the relationship with crop physiological/physical
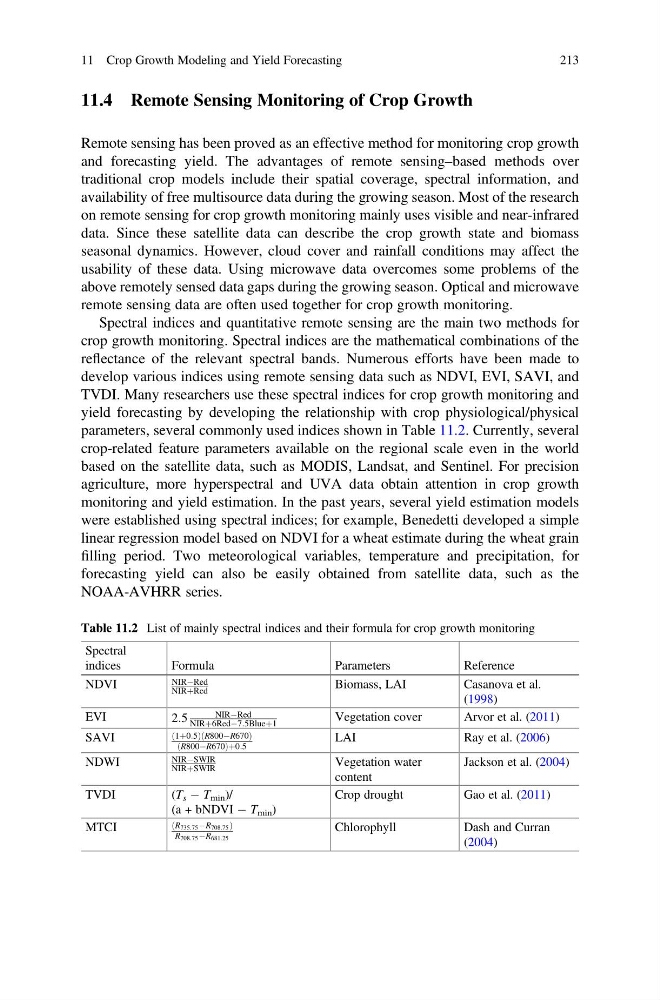
parameters, several commonly used indices shown in Table 11.2. Currently, several
crop-related feature parameters available on the regional scale even in the world
based on the satellite data, such as MODIS, Landsat, and Sentinel. For precision
agriculture, more hyperspectral and UVA data obtain attention in crop growth
monitoring and yield estimation. In the past years, several yield estimation models
were established using spectral indices; for example, Benedetti developed a simple
linear regression model based on NDVI for a wheat estimate during the wheat grain
filling period. Two meteorological variables, temperature and precipitation, for
forecasting yield can also be easily obtained from satellite data, such as the
NOAA-AVHRR series.
Table 11.2 List of mainly spectral indices and their formula for crop growth monitoring
Spectral
indices
Formula
Parameters
Reference
NDVI
NIRÀRed
NIRþRed
Biomass, LAI
Casanova et al.
(1998)
EVI
2:5
NIRÀRed
NIRþ6RedÀ7:5Blueþ1
Vegetation cover
Arvor et al. (2011)
SAVI
1þ0:5
ð
ÞR800ÀR670 ð
Þ
R800ÀR670
ð
Þ þ 0:5
LAI
Ray et al. (2006)
NDWI
NIRÀSWIR
NIRþSWIR
Vegetation water
content
Jackson et al. (2004)
TVDI
(T s À T min )/
(a + bNDVI À T min )
Crop drought
Gao et al. (2011)
MTCI
R735:75ÀR708:75
ð
Þ
R708:75ÀR681:25
Chlorophyll
Dash and Curran
(2004)
11 Crop Growth Modeling and Yield Forecasting
213
Remote sensing has been proved as an effective method for monitoring crop growth
and forecasting yield. The advantages of remote sensing–based methods over
traditional crop models include their spatial coverage, spectral information, and
availability of free multisource data during the growing season. Most of the research
on remote sensing for crop growth monitoring mainly uses visible and near-infrared
data. Since these satellite data can describe the crop growth state and biomass
seasonal dynamics. However, cloud cover and rainfall conditions may affect the
usability of these data. Using microwave data overcomes some problems of the
above remotely sensed data gaps during the growing season. Optical and microwave
remote sensing data are often used together for crop growth monitoring.
Spectral indices and quantitative remote sensing are the main two methods for
crop growth monitoring. Spectral indices are the mathematical combinations of the
reflectance of the relevant spectral bands. Numerous efforts have been made to
develop various indices using remote sensing data such as NDVI, EVI, SAVI, and
TVDI. Many researchers use these spectral indices for crop growth monitoring and
yield forecasting by developing the relationship with crop physiological/physical
parameters, several commonly used indices shown in Table 11.2. Currently, several
crop-related feature parameters available on the regional scale even in the world
based on the satellite data, such as MODIS, Landsat, and Sentinel. For precision
agriculture, more hyperspectral and UVA data obtain attention in crop growth
monitoring and yield estimation. In the past years, several yield estimation models
were established using spectral indices; for example, Benedetti developed a simple
linear regression model based on NDVI for a wheat estimate during the wheat grain
filling period. Two meteorological variables, temperature and precipitation, for
forecasting yield can also be easily obtained from satellite data, such as the
NOAA-AVHRR series.
Table 11.2 List of mainly spectral indices and their formula for crop growth monitoring
Spectral
indices
Formula
Parameters
Reference
NDVI
NIRÀRed
NIRþRed
Biomass, LAI
Casanova et al.
(1998)
EVI
2:5
NIRÀRed
NIRþ6RedÀ7:5Blueþ1
Vegetation cover
Arvor et al. (2011)
SAVI
1þ0:5
ð
ÞR800ÀR670 ð
Þ
R800ÀR670
ð
Þ þ 0:5
LAI
Ray et al. (2006)
NDWI
NIRÀSWIR
NIRþSWIR
Vegetation water
content
Jackson et al. (2004)
TVDI
(T s À T min )/
(a + bNDVI À T min )
Crop drought
Gao et al. (2011)
MTCI
R735:75ÀR708:75
ð
Þ
R708:75ÀR681:25
Chlorophyll
Dash and Curran
(2004)
11 Crop Growth Modeling and Yield Forecasting
213