

10.3.3.2 Global Agricultural Monitoring
The Global Agriculture Monitoring (GLAM) project built an operational global
agricultural monitoring system for the USDA Foreign Agricultural Service (FAS)
(Becker-Reshef et al. 2010a). MODIS is used as the primary satellite remotely
sensed data for evaluating and assessing crop status globally at coarse and moderate
resolution. The 8-day and 16-day products of surface reflectance and vegetation
indices are produced out of MODIS. Cumulative vegetation index (CVI) is also
computed from the start of the growing season. Multiple period CVI anomaly is also
computed to represent the crop status compared against the average total greenness
over all previous seasons (Becker-Reshef et al. 2010a).
10.3.3.3 Other Operational Crop Status Monitoring Systems
There are several other operational crop status monitoring systems that use remote
sensing as one of their data sources. The Monitoring Agricultural ResourceS
(MARS) of the Joint Research Center (JRC) of the European Union is one of the
long-running operational agricultural monitoring programs. Remote sensing is one
of the main techniques in addition to the statistic approach. The remotely sensed data
are NOAA Advanced Very-High Resolution Radiometer (AVHRR), METOP
AVHRR, SPOT- VEGETATION , TERRA-MODIS, and MSG-SERVIRI. Crop
condition indicators from remote sensing are reported as the fraction of photosynthetically active radiation (fPAR) in the monthly crop monitoring bulletin (Baruth
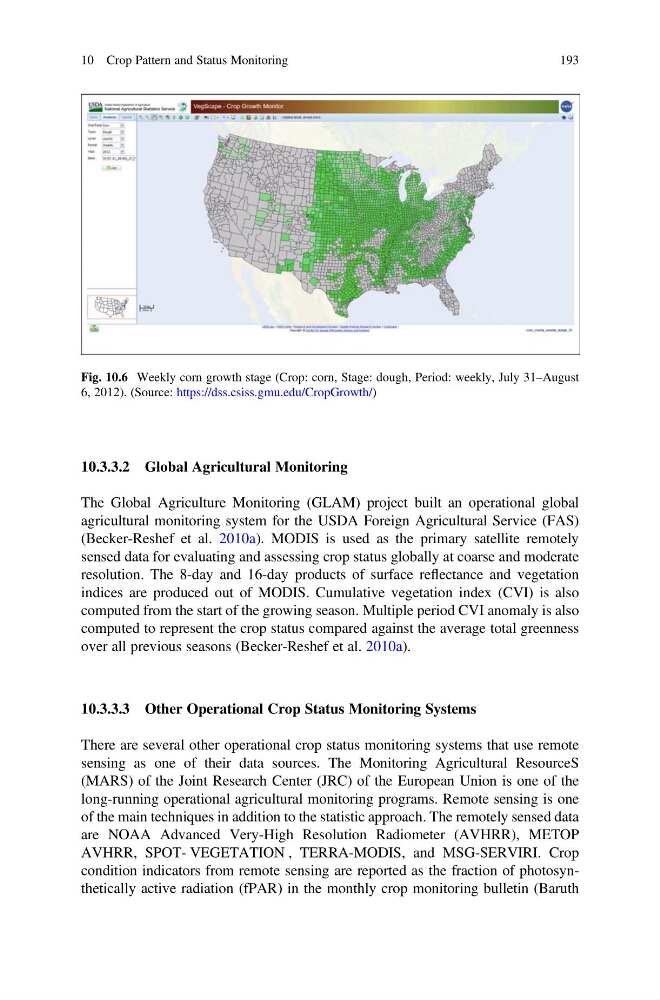
Fig. 10.6 Weekly corn growth stage (Crop: corn, Stage: dough, Period: weekly, July 31–August
6, 2012). (Source: https://dss.csiss.gmu.edu/CropGrowth/)
10 Crop Pattern and Status Monitoring
193
The Global Agriculture Monitoring (GLAM) project built an operational global
agricultural monitoring system for the USDA Foreign Agricultural Service (FAS)
(Becker-Reshef et al. 2010a). MODIS is used as the primary satellite remotely
sensed data for evaluating and assessing crop status globally at coarse and moderate
resolution. The 8-day and 16-day products of surface reflectance and vegetation
indices are produced out of MODIS. Cumulative vegetation index (CVI) is also
computed from the start of the growing season. Multiple period CVI anomaly is also
computed to represent the crop status compared against the average total greenness
over all previous seasons (Becker-Reshef et al. 2010a).
10.3.3.3 Other Operational Crop Status Monitoring Systems
There are several other operational crop status monitoring systems that use remote
sensing as one of their data sources. The Monitoring Agricultural ResourceS
(MARS) of the Joint Research Center (JRC) of the European Union is one of the
long-running operational agricultural monitoring programs. Remote sensing is one
of the main techniques in addition to the statistic approach. The remotely sensed data
are NOAA Advanced Very-High Resolution Radiometer (AVHRR), METOP
AVHRR, SPOT- VEGETATION , TERRA-MODIS, and MSG-SERVIRI. Crop
condition indicators from remote sensing are reported as the fraction of photosynthetically active radiation (fPAR) in the monthly crop monitoring bulletin (Baruth
Fig. 10.6 Weekly corn growth stage (Crop: corn, Stage: dough, Period: weekly, July 31–August
6, 2012). (Source: https://dss.csiss.gmu.edu/CropGrowth/)
10 Crop Pattern and Status Monitoring
193