

(Mueller 2013; Yang et al. 2013; Di et al. 2015; Yang et al. 2016). Remote sensing
data from NASA have been used extensively in assessing the crop condition in a
timely fashion. The process involves all aspects of the geospatial processing
described in the previous section.
Several crop condition indices are calculated with a pre-configured, timed,
automatic geospatial processing workflow that reduces the delay from satellite
observations to the product at minimum. The MODIS and its products from
NASA are used as the base to compute the crop condition indices. These indices
are NDVI, vegetation condition index (VCI), ratio to previous year vegetation
condition index (RVCI), ratio to median vegetation condition index (RMVCI) of
the previous years since 2000, and mean vegetation condition index (MVCI) (Yang
et al. 2011b; Mueller 2013). The maximum composite of these products at weekly
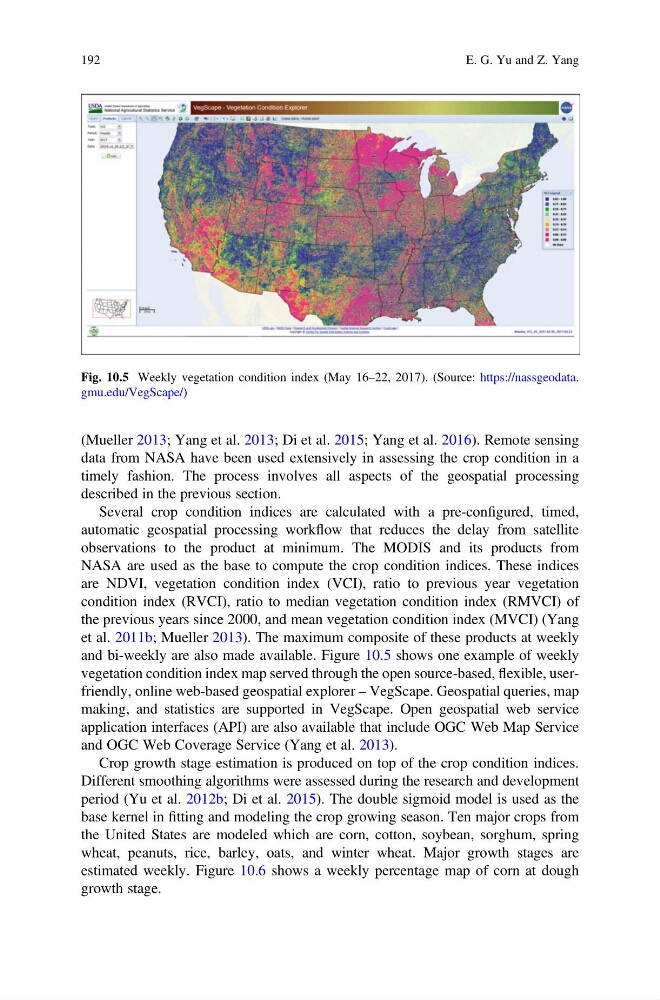
and bi-weekly are also made available. Figure 10.5 shows one example of weekly
vegetation condition index map served through the open source-based, flexible, userfriendly, online web-based geospatial explorer – VegScape. Geospatial queries, map
making, and statistics are supported in VegScape. Open geospatial web service
application interfaces (API) are also available that include OGC Web Map Service
and OGC Web Coverage Service (Yang et al. 2013).
Crop growth stage estimation is produced on top of the crop condition indices.
Different smoothing algorithms were assessed during the research and development
period (Yu et al. 2012b; Di et al. 2015). The double sigmoid model is used as the
base kernel in fitting and modeling the crop growing season. Ten major crops from
the United States are modeled which are corn, cotton, soybean, sorghum, spring
wheat, peanuts, rice, barley, oats, and winter wheat. Major growth stages are
estimated weekly. Figure 10.6 shows a weekly percentage map of corn at dough
growth stage.
Fig. 10.5 Weekly vegetation condition index (May 16–22, 2017). (Source: https://nassgeodata.
gmu.edu/VegScape/)
192
E. G. Yu and Z. Yang
data from NASA have been used extensively in assessing the crop condition in a
timely fashion. The process involves all aspects of the geospatial processing
described in the previous section.
Several crop condition indices are calculated with a pre-configured, timed,
automatic geospatial processing workflow that reduces the delay from satellite
observations to the product at minimum. The MODIS and its products from
NASA are used as the base to compute the crop condition indices. These indices
are NDVI, vegetation condition index (VCI), ratio to previous year vegetation
condition index (RVCI), ratio to median vegetation condition index (RMVCI) of
the previous years since 2000, and mean vegetation condition index (MVCI) (Yang
et al. 2011b; Mueller 2013). The maximum composite of these products at weekly
and bi-weekly are also made available. Figure 10.5 shows one example of weekly
vegetation condition index map served through the open source-based, flexible, userfriendly, online web-based geospatial explorer – VegScape. Geospatial queries, map
making, and statistics are supported in VegScape. Open geospatial web service
application interfaces (API) are also available that include OGC Web Map Service
and OGC Web Coverage Service (Yang et al. 2013).
Crop growth stage estimation is produced on top of the crop condition indices.
Different smoothing algorithms were assessed during the research and development
period (Yu et al. 2012b; Di et al. 2015). The double sigmoid model is used as the
base kernel in fitting and modeling the crop growing season. Ten major crops from
the United States are modeled which are corn, cotton, soybean, sorghum, spring
wheat, peanuts, rice, barley, oats, and winter wheat. Major growth stages are
estimated weekly. Figure 10.6 shows a weekly percentage map of corn at dough
growth stage.
Fig. 10.5 Weekly vegetation condition index (May 16–22, 2017). (Source: https://nassgeodata.
gmu.edu/VegScape/)
192
E. G. Yu and Z. Yang