

be crop absolute condition index thresholds, empirical modeling, relative change
ratio thresholds, maximum change rate, or function fitting (Yu et al. 2012b; Di et al.
2015). Most of these approaches require the full data covering the complete growing
season. Some of these only detect the onset of phenology stages in terms of remote
sensing. This remote sensing–derived crop growth stages may not be exactly
interpreted and related to the physiological phenology stages. The relationship
may be different from crop to crop and from location to location. Nevertheless,
there exist a strong relationship between remote sensing-derived stages and physiological stages. To a certain degree and application areas, the remote-sensed phenology stages can be transformed and used to relate to the actual phenology stages.
For the in-season monitoring and estimating of crop growth stages, the method has to
be adapted to work with the previous year model or typical model with limited fitting
and input data. In the study (Yu et al. 2012b), the progressive double sigmoid model
fitting (PDSMF) algorithm, an approach of three partial model fittings, was developed and applied to estimate corn growth stages in the United States. In PDSMF, the
asymmetric double sigmoid model was adopted as the kernel to be fitted using
filtered “good” NDVI data profile. Three different models are used depending on
three estimating stages, respectively. The study assumed that the NDVI profile has a
single mode which meets the growth development of corn in Unites States. The three
estimating stages are pre-peak, early post-peak, and later post-peak. The double
sigmoid model of the same crop at approximate location in the previous year is used
as the base double sigmoid model during pre-peak and early post-peak stages.
During the pre-peak period, only the shift of the previous year model is enabled
by modeling one free parameter. During the early-post period, the shift and flatting
of the previous year model is enabled by modeling three parameters. During the late
post-peak period, all parameters are open to be modeled that would create a newly fit
double sigmoid model. This approach efficiently utilizes the historical knowledge
and available data at the time of estimation. The results of the study show reasonable
accuracy in the validation using surveyed datasets from the USDA NASA.
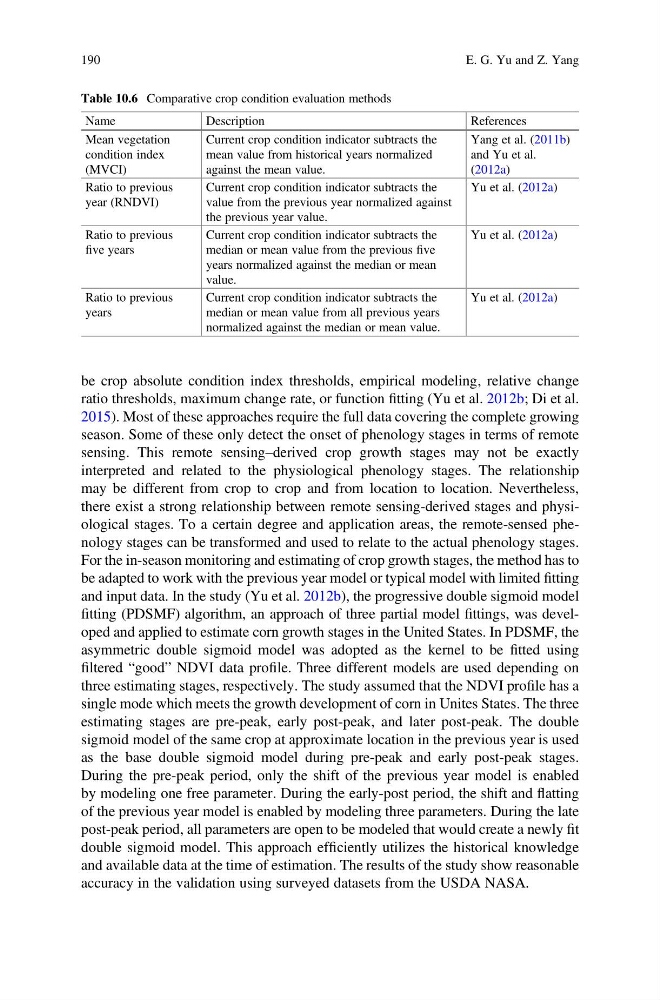
Table 10.6 Comparative crop condition evaluation methods
Name
Description
References
Mean vegetation
condition index
(MVCI)
Current crop condition indicator subtracts the
mean value from historical years normalized
against the mean value.
Yang et al. (2011b)
and Yu et al.
(2012a)
Ratio to previous
year (RNDVI)
Current crop condition indicator subtracts the
value from the previous year normalized against
the previous year value.
Yu et al. (2012a)
Ratio to previous
five years
Current crop condition indicator subtracts the
median or mean value from the previous five
years normalized against the median or mean
value.
Yu et al. (2012a)
Ratio to previous
years
Current crop condition indicator subtracts the
median or mean value from all previous years
normalized against the median or mean value.
Yu et al. (2012a)
190
E. G. Yu and Z. Yang
ratio thresholds, maximum change rate, or function fitting (Yu et al. 2012b; Di et al.
2015). Most of these approaches require the full data covering the complete growing
season. Some of these only detect the onset of phenology stages in terms of remote
sensing. This remote sensing–derived crop growth stages may not be exactly
interpreted and related to the physiological phenology stages. The relationship
may be different from crop to crop and from location to location. Nevertheless,
there exist a strong relationship between remote sensing-derived stages and physiological stages. To a certain degree and application areas, the remote-sensed phenology stages can be transformed and used to relate to the actual phenology stages.
For the in-season monitoring and estimating of crop growth stages, the method has to
be adapted to work with the previous year model or typical model with limited fitting
and input data. In the study (Yu et al. 2012b), the progressive double sigmoid model
fitting (PDSMF) algorithm, an approach of three partial model fittings, was developed and applied to estimate corn growth stages in the United States. In PDSMF, the
asymmetric double sigmoid model was adopted as the kernel to be fitted using
filtered “good” NDVI data profile. Three different models are used depending on
three estimating stages, respectively. The study assumed that the NDVI profile has a
single mode which meets the growth development of corn in Unites States. The three
estimating stages are pre-peak, early post-peak, and later post-peak. The double
sigmoid model of the same crop at approximate location in the previous year is used
as the base double sigmoid model during pre-peak and early post-peak stages.
During the pre-peak period, only the shift of the previous year model is enabled
by modeling one free parameter. During the early-post period, the shift and flatting
of the previous year model is enabled by modeling three parameters. During the late
post-peak period, all parameters are open to be modeled that would create a newly fit
double sigmoid model. This approach efficiently utilizes the historical knowledge
and available data at the time of estimation. The results of the study show reasonable
accuracy in the validation using surveyed datasets from the USDA NASA.
Table 10.6 Comparative crop condition evaluation methods
Name
Description
References
Mean vegetation
condition index
(MVCI)
Current crop condition indicator subtracts the
mean value from historical years normalized
against the mean value.
Yang et al. (2011b)
and Yu et al.
(2012a)
Ratio to previous
year (RNDVI)
Current crop condition indicator subtracts the
value from the previous year normalized against
the previous year value.
Yu et al. (2012a)
Ratio to previous
five years
Current crop condition indicator subtracts the
median or mean value from the previous five
years normalized against the median or mean
value.
Yu et al. (2012a)
Ratio to previous
years
Current crop condition indicator subtracts the
median or mean value from all previous years
normalized against the median or mean value.
Yu et al. (2012a)
190
E. G. Yu and Z. Yang