

The higher the VCI is, the more favorable the water condition of the cropland is,
and the crop is more likely in good condition. VHI is another indicator that
combines both water (i.e., VCI) and temperature (i.e., TCI) to indirectly indicate
the degrees of favorite water and heat condition for crop growth. It can be used as
a direct indicator to the crop status. In addition, an empirical model may be
established to relate crop conditions to crop yield at the end of the growing season
(Dadhwal and Ray 2000; Shrestha et al. 2016). Regression models are commonly
used to correlate crop yield to crop vegetation indices, e.g., NDVI (Li et al. 2007;
Becker-Reshef et al. 2010b; Shrestha et al. 2016). The capability to forecast and
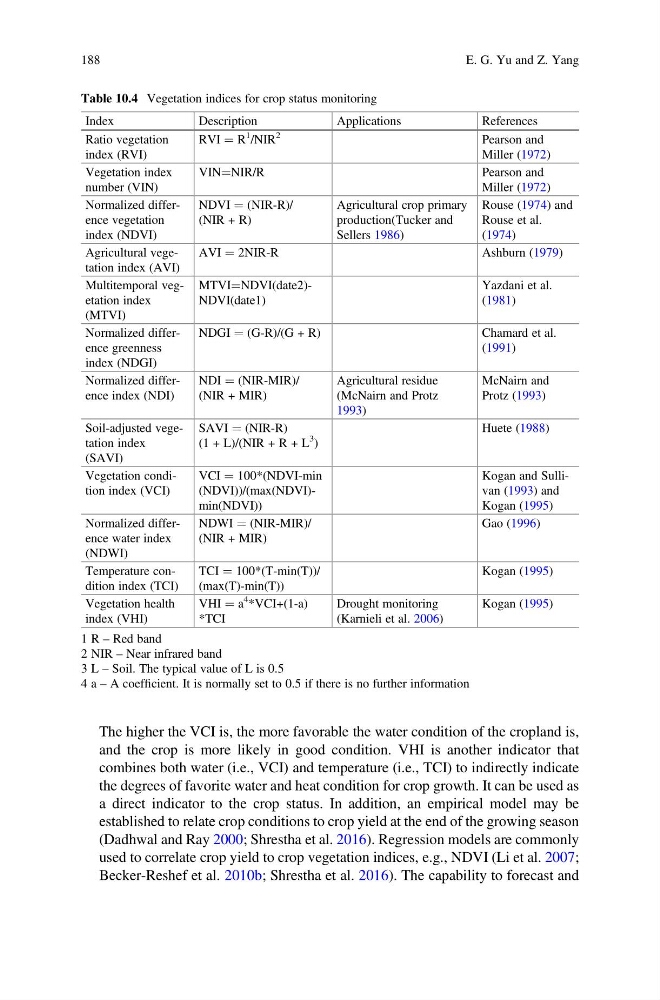
Table 10.4 Vegetation indices for crop status monitoring
Index
Description
Applications
References
Ratio vegetation
index (RVI)
RVI ¼ R
1
/NIR
2
Pearson and
Miller (1972)
Vegetation index
number (VIN)
VIN¼NIR/R
Pearson and
Miller (1972)
Normalized difference vegetation
index (NDVI)
NDVI ¼ (NIR-R)/
(NIR + R)
Agricultural crop primary
production(Tucker and
Sellers 1986)
Rouse (1974) and
Rouse et al.
(1974)
Agricultural vegetation index (AVI)
AVI ¼ 2NIR-R
Ashburn (1979)
Multitemporal vegetation index
(MTVI)
MTVI¼NDVI(date2)NDVI(date1)
Yazdani et al.
(1981)
Normalized difference greenness
index (NDGI)
NDGI ¼ (G-R)/(G + R)
Chamard et al.
(1991)
Normalized difference index (NDI)
NDI ¼ (NIR-MIR)/
(NIR + MIR)
Agricultural residue
(McNairn and Protz
1993)
McNairn and
Protz (1993)
Soil-adjusted vegetation index
(SAVI)
SAVI ¼ (NIR-R)
(1 + L)/(NIR + R + L
3
)
Huete (1988)
Vegetation condition index (VCI)
VCI ¼ 100*(NDVI-min
(NDVI))/(max(NDVI)min(NDVI))
Kogan and Sullivan (1993) and
Kogan (1995)
Normalized difference water index
(NDWI)
NDWI ¼ (NIR-MIR)/
(NIR + MIR)
Gao (1996)
Temperature condition index (TCI)
TCI ¼ 100*(T-min(T))/
(max(T)-min(T))
Kogan (1995)
Vegetation health
index (VHI)
VHI ¼ a
4
*VCI+(1-a)
*TCI
Drought monitoring
(Karnieli et al. 2006)
Kogan (1995)
1 R – Red band
2 NIR – Near infrared band
3 L – Soil. The typical value of L is 0.5
4 a – A coefficient. It is normally set to 0.5 if there is no further information
188
E. G. Yu and Z. Yang
and the crop is more likely in good condition. VHI is another indicator that
combines both water (i.e., VCI) and temperature (i.e., TCI) to indirectly indicate
the degrees of favorite water and heat condition for crop growth. It can be used as
a direct indicator to the crop status. In addition, an empirical model may be
established to relate crop conditions to crop yield at the end of the growing season
(Dadhwal and Ray 2000; Shrestha et al. 2016). Regression models are commonly
used to correlate crop yield to crop vegetation indices, e.g., NDVI (Li et al. 2007;
Becker-Reshef et al. 2010b; Shrestha et al. 2016). The capability to forecast and
Table 10.4 Vegetation indices for crop status monitoring
Index
Description
Applications
References
Ratio vegetation
index (RVI)
RVI ¼ R
1
/NIR
2
Pearson and
Miller (1972)
Vegetation index
number (VIN)
VIN¼NIR/R
Pearson and
Miller (1972)
Normalized difference vegetation
index (NDVI)
NDVI ¼ (NIR-R)/
(NIR + R)
Agricultural crop primary
production(Tucker and
Sellers 1986)
Rouse (1974) and
Rouse et al.
(1974)
Agricultural vegetation index (AVI)
AVI ¼ 2NIR-R
Ashburn (1979)
Multitemporal vegetation index
(MTVI)
MTVI¼NDVI(date2)NDVI(date1)
Yazdani et al.
(1981)
Normalized difference greenness
index (NDGI)
NDGI ¼ (G-R)/(G + R)
Chamard et al.
(1991)
Normalized difference index (NDI)
NDI ¼ (NIR-MIR)/
(NIR + MIR)
Agricultural residue
(McNairn and Protz
1993)
McNairn and
Protz (1993)
Soil-adjusted vegetation index
(SAVI)
SAVI ¼ (NIR-R)
(1 + L)/(NIR + R + L
3
)
Huete (1988)
Vegetation condition index (VCI)
VCI ¼ 100*(NDVI-min
(NDVI))/(max(NDVI)min(NDVI))
Kogan and Sullivan (1993) and
Kogan (1995)
Normalized difference water index
(NDWI)
NDWI ¼ (NIR-MIR)/
(NIR + MIR)
Gao (1996)
Temperature condition index (TCI)
TCI ¼ 100*(T-min(T))/
(max(T)-min(T))
Kogan (1995)
Vegetation health
index (VHI)
VHI ¼ a
4
*VCI+(1-a)
*TCI
Drought monitoring
(Karnieli et al. 2006)
Kogan (1995)
1 R – Red band
2 NIR – Near infrared band
3 L – Soil. The typical value of L is 0.5
4 a – A coefficient. It is normally set to 0.5 if there is no further information
188
E. G. Yu and Z. Yang