

represent bare soil. We have used multitemporal Landsat 7 and Landsat 8 images in
the computation of NDVI values listed in the Appendix. A linear transformation has
been applied for the continuity of the data between Landsat 7 and Landsat 8 images
(Flood 2014). Curve fitting on multitemporal data has been used to recover some
cloudiness-related problems although the annual sunshine duration is as high as
2993 h in the region.
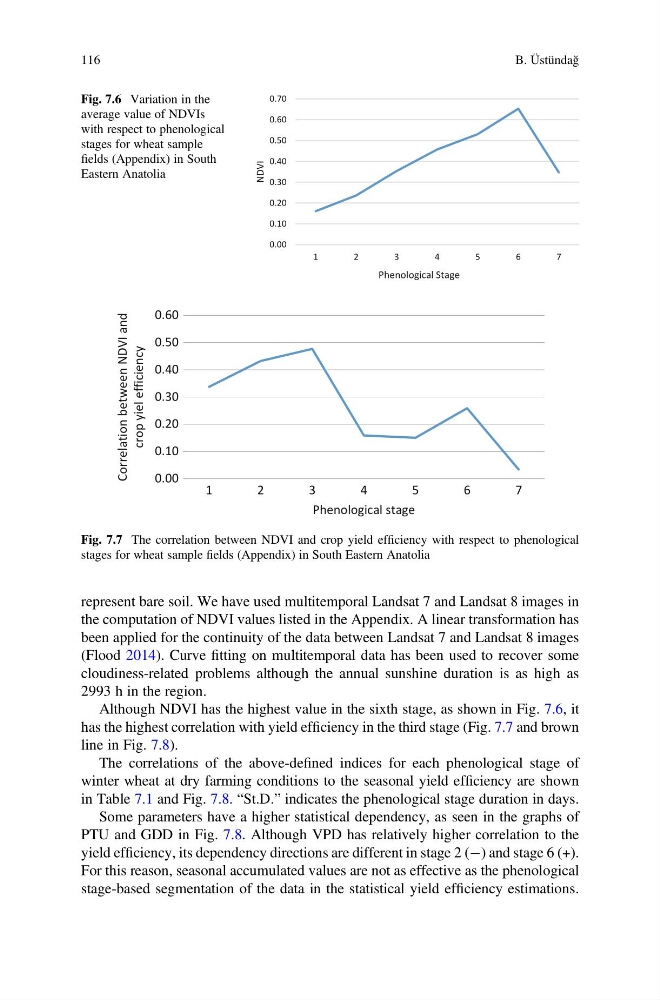
Although NDVI has the highest value in the sixth stage, as shown in Fig. 7.6, it
has the highest correlation with yield efficiency in the third stage (Fig. 7.7 and brown
line in Fig. 7.8).
The correlations of the above-defined indices for each phenological stage of
winter wheat at dry farming conditions to the seasonal yield efficiency are shown
in Table 7.1 and Fig. 7.8. “St.D.” indicates the phenological stage duration in days.
Some parameters have a higher statistical dependency, as seen in the graphs of
PTU and GDD in Fig. 7.8. Although VPD has relatively higher correlation to the
yield efficiency, its dependency directions are different in stage 2 (À) and stage 6 (+).
For this reason, seasonal accumulated values are not as effective as the phenological
stage-based segmentation of the data in the statistical yield efficiency estimations.
0.00
0.10
0.20
0.30
0.40
0.50
0.60
0.70
1
2
3
4
5
6
7
NDVI
Phenological Stage
Fig. 7.6 Variation in the
average value of NDVIs
with respect to phenological
stages for wheat sample
fields (Appendix) in South
Eastern Anatolia
0.00
0.10
0.20
0.30
0.40
0.50
0.60
1
2
3
4
5
6
7
Correlation between NDVI and
crop yiel efficiency
Phenological stage
Fig. 7.7 The correlation between NDVI and crop yield efficiency with respect to phenological
stages for wheat sample fields (Appendix) in South Eastern Anatolia
116
B. Üstündağ
the computation of NDVI values listed in the Appendix. A linear transformation has
been applied for the continuity of the data between Landsat 7 and Landsat 8 images
(Flood 2014). Curve fitting on multitemporal data has been used to recover some
cloudiness-related problems although the annual sunshine duration is as high as
2993 h in the region.
Although NDVI has the highest value in the sixth stage, as shown in Fig. 7.6, it
has the highest correlation with yield efficiency in the third stage (Fig. 7.7 and brown
line in Fig. 7.8).
The correlations of the above-defined indices for each phenological stage of
winter wheat at dry farming conditions to the seasonal yield efficiency are shown
in Table 7.1 and Fig. 7.8. “St.D.” indicates the phenological stage duration in days.
Some parameters have a higher statistical dependency, as seen in the graphs of
PTU and GDD in Fig. 7.8. Although VPD has relatively higher correlation to the
yield efficiency, its dependency directions are different in stage 2 (À) and stage 6 (+).
For this reason, seasonal accumulated values are not as effective as the phenological
stage-based segmentation of the data in the statistical yield efficiency estimations.
0.00
0.10
0.20
0.30
0.40
0.50
0.60
0.70
1
2
3
4
5
6
7
NDVI
Phenological Stage
Fig. 7.6 Variation in the
average value of NDVIs
with respect to phenological
stages for wheat sample
fields (Appendix) in South
Eastern Anatolia
0.00
0.10
0.20
0.30
0.40
0.50
0.60
1
2
3
4
5
6
7
Correlation between NDVI and
crop yiel efficiency
Phenological stage
Fig. 7.7 The correlation between NDVI and crop yield efficiency with respect to phenological
stages for wheat sample fields (Appendix) in South Eastern Anatolia
116
B. Üstündağ