

4 RESULTS AND DISCUSSION
4.1 PM 2.5 emanating from different mining areas in
Africa with time
This section focuses on the level of PM 2.5 produced
from different mining areas inAfrica.The mining areas
are Geita and Bulyanhulu gold mines in Tanzania, Kilimapesa and Karebe mines in Kenya, Anglo Ashanti
Obuasi and Tarkwa Gold field in Ghana.
According to the WHO air quality guidelines (WHO
2005), the annual mean of PM 2.5 is 10 µg/m
2 and the
monthly mean is 25 µg/m
2 .
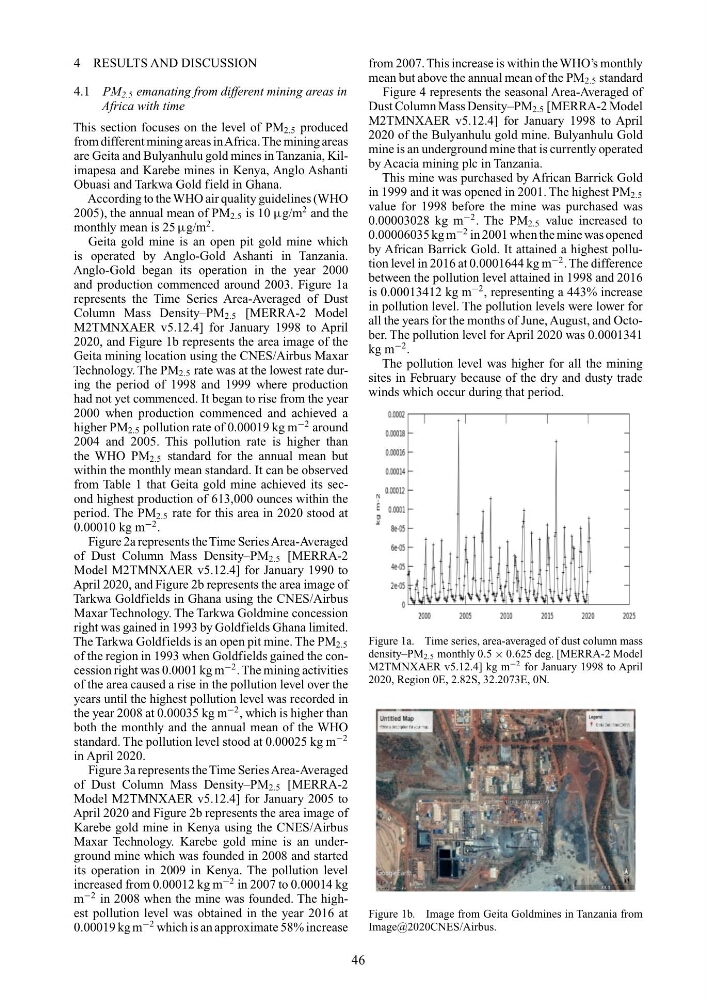
Geita gold mine is an open pit gold mine which
is operated by Anglo-Gold Ashanti in Tanzania.
Anglo-Gold began its operation in the year 2000
and production commenced around 2003. Figure 1a
represents the Time Series Area-Averaged of Dust
Column Mass Density–PM 2.5 [MERRA-2 Model
M2TMNXAER v5.12.4] for January 1998 to April
2020, and Figure 1b represents the area image of the
Geita mining location using the CNES/Airbus Maxar
Technology. The PM 2.5 rate was at the lowest rate during the period of 1998 and 1999 where production
had not yet commenced. It began to rise from the year
2000 when production commenced and achieved a
higher PM 2.5 pollution rate of 0.00019 kg m
−2 around
2004 and 2005. This pollution rate is higher than
the WHO PM 2.5 standard for the annual mean but
within the monthly mean standard. It can be observed
from Table 1 that Geita gold mine achieved its second highest production of 613,000 ounces within the
period. The PM 2.5 rate for this area in 2020 stood at
0.00010 kg m
−2 .
Figure 2a represents the Time Series Area-Averaged
of Dust Column Mass Density–PM 2.5 [MERRA-2
Model M2TMNXAER v5.12.4] for January 1990 to
April 2020, and Figure 2b represents the area image of
Tarkwa Goldfields in Ghana using the CNES/Airbus
Maxar Technology. The Tarkwa Goldmine concession
right was gained in 1993 by Goldfields Ghana limited.
The Tarkwa Goldfields is an open pit mine. The PM 2.5
of the region in 1993 when Goldfields gained the concession right was 0.0001 kg m
−2 . The mining activities
of the area caused a rise in the pollution level over the
years until the highest pollution level was recorded in
the year 2008 at 0.00035 kg m
−2 , which is higher than
both the monthly and the annual mean of the WHO
standard. The pollution level stood at 0.00025 kg m
−2
in April 2020.
Figure 3a represents the Time Series Area-Averaged
of Dust Column Mass Density–PM 2.5 [MERRA-2
Model M2TMNXAER v5.12.4] for January 2005 to
April 2020 and Figure 2b represents the area image of
Karebe gold mine in Kenya using the CNES/Airbus
Maxar Technology. Karebe gold mine is an underground mine which was founded in 2008 and started
its operation in 2009 in Kenya. The pollution level
increased from 0.00012 kg m
−2 in 2007 to 0.00014 kg
m
−2 in 2008 when the mine was founded. The highest pollution level was obtained in the year 2016 at
0.00019 kg m
−2 which is an approximate 58% increase
from 2007. This increase is within the WHO’s monthly
mean but above the annual mean of the PM 2.5 standard
Figure 4 represents the seasonal Area-Averaged of
Dust Column Mass Density–PM 2.5 [MERRA-2 Model
M2TMNXAER v5.12.4] for January 1998 to April
2020 of the Bulyanhulu gold mine. Bulyanhulu Gold
mine is an underground mine that is currently operated
by Acacia mining plc in Tanzania.
This mine was purchased by African Barrick Gold
in 1999 and it was opened in 2001. The highest PM 2.5
value for 1998 before the mine was purchased was
0.00003028 kg m
−2 . The PM 2.5 value increased to
0.00006035 kg m
−2 in 2001 when the mine was opened
by African Barrick Gold. It attained a highest pollution level in 2016 at 0.0001644 kg m
−2 . The difference
between the pollution level attained in 1998 and 2016
is 0.00013412 kg m
−2 , representing a 443% increase
in pollution level. The pollution levels were lower for
all the years for the months of June, August, and October. The pollution level for April 2020 was 0.0001341
kg m
−2 .
The pollution level was higher for all the mining
sites in February because of the dry and dusty trade
winds which occur during that period.
Figure 1a. Time series, area-averaged of dust column mass
density–PM 2.5 monthly 0.5 × 0.625 deg. [MERRA-2 Model
M2TMNXAER v5.12.4] kg m
−2 for January 1998 to April
2020, Region 0E, 2.82S, 32.2073E, 0N.
Figure 1b. Image from Geita Goldmines in Tanzania from
Image@2020CNES/Airbus.
46
4.1 PM 2.5 emanating from different mining areas in
Africa with time
This section focuses on the level of PM 2.5 produced
from different mining areas inAfrica.The mining areas
are Geita and Bulyanhulu gold mines in Tanzania, Kilimapesa and Karebe mines in Kenya, Anglo Ashanti
Obuasi and Tarkwa Gold field in Ghana.
According to the WHO air quality guidelines (WHO
2005), the annual mean of PM 2.5 is 10 µg/m
2 and the
monthly mean is 25 µg/m
2 .
Geita gold mine is an open pit gold mine which
is operated by Anglo-Gold Ashanti in Tanzania.
Anglo-Gold began its operation in the year 2000
and production commenced around 2003. Figure 1a
represents the Time Series Area-Averaged of Dust
Column Mass Density–PM 2.5 [MERRA-2 Model
M2TMNXAER v5.12.4] for January 1998 to April
2020, and Figure 1b represents the area image of the
Geita mining location using the CNES/Airbus Maxar
Technology. The PM 2.5 rate was at the lowest rate during the period of 1998 and 1999 where production
had not yet commenced. It began to rise from the year
2000 when production commenced and achieved a
higher PM 2.5 pollution rate of 0.00019 kg m
−2 around
2004 and 2005. This pollution rate is higher than
the WHO PM 2.5 standard for the annual mean but
within the monthly mean standard. It can be observed
from Table 1 that Geita gold mine achieved its second highest production of 613,000 ounces within the
period. The PM 2.5 rate for this area in 2020 stood at
0.00010 kg m
−2 .
Figure 2a represents the Time Series Area-Averaged
of Dust Column Mass Density–PM 2.5 [MERRA-2
Model M2TMNXAER v5.12.4] for January 1990 to
April 2020, and Figure 2b represents the area image of
Tarkwa Goldfields in Ghana using the CNES/Airbus
Maxar Technology. The Tarkwa Goldmine concession
right was gained in 1993 by Goldfields Ghana limited.
The Tarkwa Goldfields is an open pit mine. The PM 2.5
of the region in 1993 when Goldfields gained the concession right was 0.0001 kg m
−2 . The mining activities
of the area caused a rise in the pollution level over the
years until the highest pollution level was recorded in
the year 2008 at 0.00035 kg m
−2 , which is higher than
both the monthly and the annual mean of the WHO
standard. The pollution level stood at 0.00025 kg m
−2
in April 2020.
Figure 3a represents the Time Series Area-Averaged
of Dust Column Mass Density–PM 2.5 [MERRA-2
Model M2TMNXAER v5.12.4] for January 2005 to
April 2020 and Figure 2b represents the area image of
Karebe gold mine in Kenya using the CNES/Airbus
Maxar Technology. Karebe gold mine is an underground mine which was founded in 2008 and started
its operation in 2009 in Kenya. The pollution level
increased from 0.00012 kg m
−2 in 2007 to 0.00014 kg
m
−2 in 2008 when the mine was founded. The highest pollution level was obtained in the year 2016 at
0.00019 kg m
−2 which is an approximate 58% increase
from 2007. This increase is within the WHO’s monthly
mean but above the annual mean of the PM 2.5 standard
Figure 4 represents the seasonal Area-Averaged of
Dust Column Mass Density–PM 2.5 [MERRA-2 Model
M2TMNXAER v5.12.4] for January 1998 to April
2020 of the Bulyanhulu gold mine. Bulyanhulu Gold
mine is an underground mine that is currently operated
by Acacia mining plc in Tanzania.
This mine was purchased by African Barrick Gold
in 1999 and it was opened in 2001. The highest PM 2.5
value for 1998 before the mine was purchased was
0.00003028 kg m
−2 . The PM 2.5 value increased to
0.00006035 kg m
−2 in 2001 when the mine was opened
by African Barrick Gold. It attained a highest pollution level in 2016 at 0.0001644 kg m
−2 . The difference
between the pollution level attained in 1998 and 2016
is 0.00013412 kg m
−2 , representing a 443% increase
in pollution level. The pollution levels were lower for
all the years for the months of June, August, and October. The pollution level for April 2020 was 0.0001341
kg m
−2 .
The pollution level was higher for all the mining
sites in February because of the dry and dusty trade
winds which occur during that period.
Figure 1a. Time series, area-averaged of dust column mass
density–PM 2.5 monthly 0.5 × 0.625 deg. [MERRA-2 Model
M2TMNXAER v5.12.4] kg m
−2 for January 1998 to April
2020, Region 0E, 2.82S, 32.2073E, 0N.
Figure 1b. Image from Geita Goldmines in Tanzania from
Image@2020CNES/Airbus.
46