

method used in this study is oversimplification of
social reality, by an arbitrary design of the questionnaire and adopting multiple-choice questions with
pre-conceived categories with an overly simple view
of reality.
Data were summarized using means and standard
deviation for continuous data, while frequency and
percentages were used for categorical data. The t-test
was used to compare ratings between groups, while
ANOVA was used to compare ratings across the three
groups.
4 RESULTS AND DISCUSSIONS
4.1 Basic data
4.1.1 Gender of participants
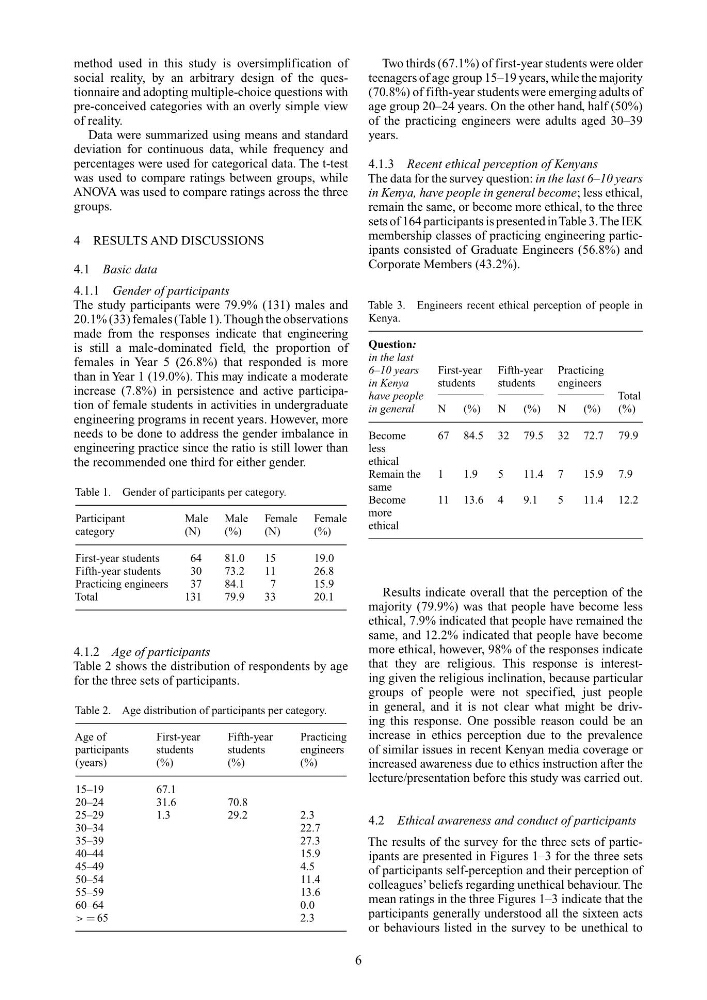
The study participants were 79.9% (131) males and
20.1% (33) females (Table 1). Though the observations
made from the responses indicate that engineering
is still a male-dominated field, the proportion of
females in Year 5 (26.8%) that responded is more
than in Year 1 (19.0%). This may indicate a moderate
increase (7.8%) in persistence and active participation of female students in activities in undergraduate
engineering programs in recent years. However, more
needs to be done to address the gender imbalance in
engineering practice since the ratio is still lower than
the recommended one third for either gender.
Table 1. Gender of participants per category.
Participant
Male Male Female Female
category
(N)
(%)
(N)
(%)
First-year students
64
81.0
15
19.0
Fifth-year students
30
73.2
11
26.8
Practicing engineers
37
84.1
7
15.9
Total
131
79.9
33
20.1
4.1.2 Age of participants
Table 2 shows the distribution of respondents by age
for the three sets of participants.
Table 2. Age distribution of participants per category.
Age of
First-year
Fifth-year
Practicing
participants
students
students
engineers
(years)
(%)
(%)
(%)
15–19
67.1
20–24
31.6
70.8
25–29
1.3
29.2
2.3
30–34
22.7
35–39
27.3
40–44
15.9
45–49
4.5
50–54
11.4
55–59
13.6
60–64
0.0
> = 65
2.3
Two thirds (67.1%) of first-year students were older
teenagers of age group 15–19 years, while the majority
(70.8%) of fifth-year students were emerging adults of
age group 20–24 years. On the other hand, half (50%)
of the practicing engineers were adults aged 30–39
years.
4.1.3 Recent ethical perception of Kenyans
The data for the survey question: in the last 6–10 years
in Kenya, have people in general become; less ethical,
remain the same, or become more ethical, to the three
sets of 164 participants is presented inTable 3. The IEK
membership classes of practicing engineering participants consisted of Graduate Engineers (56.8%) and
Corporate Members (43.2%).
Table 3. Engineers recent ethical perception of people in
Kenya.
Question:
in the last
6–10 years
First-year Fifth-year Practicing
in Kenya
students
students
engineers
have people
Total
in general
N
(%)
N
(%)
N
(%)
(%)
Become
67 84.5 32 79.5 32 72.7 79.9
less
ethical
Remain the 1
1.9
5
11.4 7
15.9 7.9
same
Become
11 13.6 4
9.1
5
11.4 12.2
more
ethical
Results indicate overall that the perception of the
majority (79.9%) was that people have become less
ethical, 7.9% indicated that people have remained the
same, and 12.2% indicated that people have become
more ethical, however, 98% of the responses indicate
that they are religious. This response is interesting given the religious inclination, because particular
groups of people were not specified, just people
in general, and it is not clear what might be driving this response. One possible reason could be an
increase in ethics perception due to the prevalence
of similar issues in recent Kenyan media coverage or
increased awareness due to ethics instruction after the
lecture/presentation before this study was carried out.
4.2 Ethical awareness and conduct of participants
The results of the survey for the three sets of participants are presented in Figures 1–3 for the three sets
of participants self-perception and their perception of
colleagues’ beliefs regarding unethical behaviour. The
mean ratings in the three Figures 1–3 indicate that the
participants generally understood all the sixteen acts
or behaviours listed in the survey to be unethical to
6
social reality, by an arbitrary design of the questionnaire and adopting multiple-choice questions with
pre-conceived categories with an overly simple view
of reality.
Data were summarized using means and standard
deviation for continuous data, while frequency and
percentages were used for categorical data. The t-test
was used to compare ratings between groups, while
ANOVA was used to compare ratings across the three
groups.
4 RESULTS AND DISCUSSIONS
4.1 Basic data
4.1.1 Gender of participants
The study participants were 79.9% (131) males and
20.1% (33) females (Table 1). Though the observations
made from the responses indicate that engineering
is still a male-dominated field, the proportion of
females in Year 5 (26.8%) that responded is more
than in Year 1 (19.0%). This may indicate a moderate
increase (7.8%) in persistence and active participation of female students in activities in undergraduate
engineering programs in recent years. However, more
needs to be done to address the gender imbalance in
engineering practice since the ratio is still lower than
the recommended one third for either gender.
Table 1. Gender of participants per category.
Participant
Male Male Female Female
category
(N)
(%)
(N)
(%)
First-year students
64
81.0
15
19.0
Fifth-year students
30
73.2
11
26.8
Practicing engineers
37
84.1
7
15.9
Total
131
79.9
33
20.1
4.1.2 Age of participants
Table 2 shows the distribution of respondents by age
for the three sets of participants.
Table 2. Age distribution of participants per category.
Age of
First-year
Fifth-year
Practicing
participants
students
students
engineers
(years)
(%)
(%)
(%)
15–19
67.1
20–24
31.6
70.8
25–29
1.3
29.2
2.3
30–34
22.7
35–39
27.3
40–44
15.9
45–49
4.5
50–54
11.4
55–59
13.6
60–64
0.0
> = 65
2.3
Two thirds (67.1%) of first-year students were older
teenagers of age group 15–19 years, while the majority
(70.8%) of fifth-year students were emerging adults of
age group 20–24 years. On the other hand, half (50%)
of the practicing engineers were adults aged 30–39
years.
4.1.3 Recent ethical perception of Kenyans
The data for the survey question: in the last 6–10 years
in Kenya, have people in general become; less ethical,
remain the same, or become more ethical, to the three
sets of 164 participants is presented inTable 3. The IEK
membership classes of practicing engineering participants consisted of Graduate Engineers (56.8%) and
Corporate Members (43.2%).
Table 3. Engineers recent ethical perception of people in
Kenya.
Question:
in the last
6–10 years
First-year Fifth-year Practicing
in Kenya
students
students
engineers
have people
Total
in general
N
(%)
N
(%)
N
(%)
(%)
Become
67 84.5 32 79.5 32 72.7 79.9
less
ethical
Remain the 1
1.9
5
11.4 7
15.9 7.9
same
Become
11 13.6 4
9.1
5
11.4 12.2
more
ethical
Results indicate overall that the perception of the
majority (79.9%) was that people have become less
ethical, 7.9% indicated that people have remained the
same, and 12.2% indicated that people have become
more ethical, however, 98% of the responses indicate
that they are religious. This response is interesting given the religious inclination, because particular
groups of people were not specified, just people
in general, and it is not clear what might be driving this response. One possible reason could be an
increase in ethics perception due to the prevalence
of similar issues in recent Kenyan media coverage or
increased awareness due to ethics instruction after the
lecture/presentation before this study was carried out.
4.2 Ethical awareness and conduct of participants
The results of the survey for the three sets of participants are presented in Figures 1–3 for the three sets
of participants self-perception and their perception of
colleagues’ beliefs regarding unethical behaviour. The
mean ratings in the three Figures 1–3 indicate that the
participants generally understood all the sixteen acts
or behaviours listed in the survey to be unethical to
6