

use of solar energy is encouraged. To make this a reality, outdoor evaluation of PV system financial benefits
over a period of time at a specified location is necessary. On the other hand, PV and solar thermal systems
are cheaper compared to DG over extended use as
noted by (8) under reasonable site of solar insolation.
Economic and energy analysis was carried by (9) in
order to evaluate the application of the building integrated PV system. Economic examination by (10) and
(11) of energy mix of DG and PV systems for a school
in India and East Malaysia respectively based on life
cycle cost (LCC) concluded that stand-alone PV system is suitable for use when energy demands are low.
Recent studies considering economic aspects of standalone PV systems were investigated in the literature;
(12–15).
Economic analysis of PV system has seen a number of studies done but further research are justifiable
because many of the works did not validate with
experimental results. In addition, updated analysis is
required by customers of PV systems to know if their
investment is still profitable with changing times. This
present study is aimed at analyzing the economic viability and potential of stand-alone solar PV power
through life cycle cost analysis method for a residential
home in western Kenya.
2 DESIGN AND METHODOLOGY
2.1 System configuration
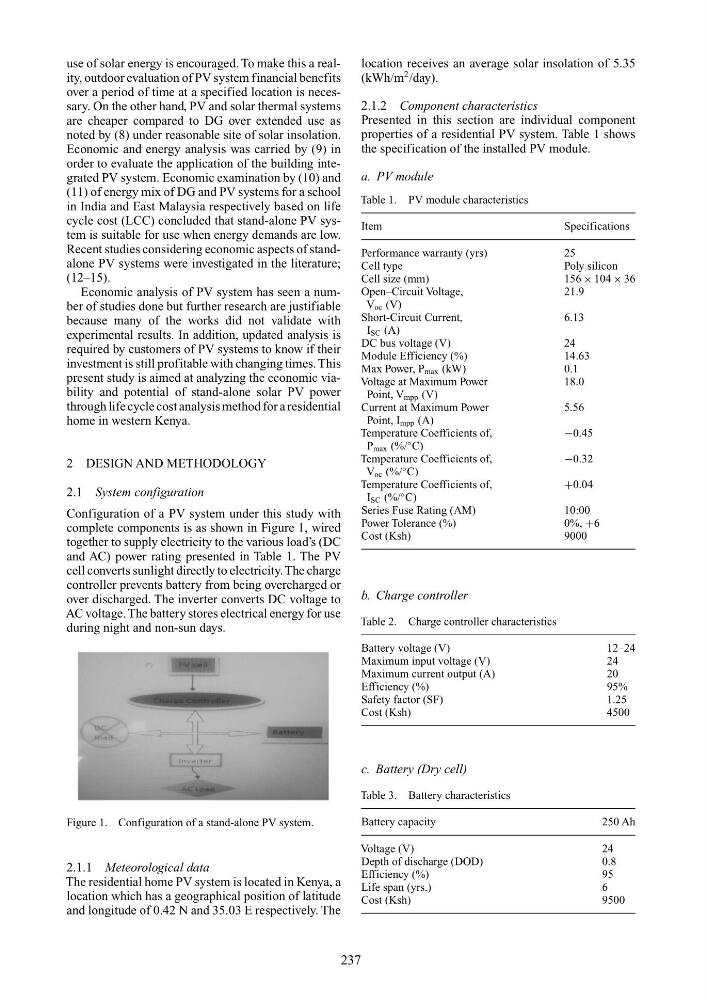
Configuration of a PV system under this study with
complete components is as shown in Figure 1, wired
together to supply electricity to the various load’s (DC
and AC) power rating presented in Table 1. The PV
cell converts sunlight directly to electricity. The charge
controller prevents battery from being overcharged or
over discharged. The inverter converts DC voltage to
AC voltage. The battery stores electrical energy for use
during night and non-sun days.
Figure 1. Configuration of a stand-alone PV system.
2.1.1 Meteorological data
The residential home PV system is located in Kenya, a
location which has a geographical position of latitude
and longitude of 0.42 N and 35.03 E respectively. The
location receives an average solar insolation of 5.35
(kWh/m
2 /day).
2.1.2 Component characteristics
Presented in this section are individual component
properties of a residential PV system. Table 1 shows
the specification of the installed PV module.
a. PV module
Table 1. PV module characteristics
Item
Specifications
Performance warranty (yrs)
25
Cell type
Poly silicon
Cell size (mm)
156 × 104 × 36
Open–Circuit Voltage,
21.9
V oc (V)
Short-Circuit Current,
6.13
I SC (A)
DC bus voltage (V)
24
Module Efficiency (%)
14.63
Max Power, P max (kW)
0.1
Voltage at Maximum Power
18.0
Point, V mpp (V)
Current at Maximum Power
5.56
Point, I mpp (A)
Temperature Coefficients of,
−0.45
P max (%/
◦ C)
Temperature Coefficients of,
−0.32
V oc (%/
◦ C)
Temperature Coefficients of,
+0.04
I SC (%/
◦ C)
Series Fuse Rating (AM)
10:00
Power Tolerance (%)
0%, +6
Cost (Ksh)
9000
b. Charge controller
Table 2. Charge controller characteristics
Battery voltage (V)
12–24
Maximum input voltage (V)
24
Maximum current output (A)
20
Efficiency (%)
95%
Safety factor (SF)
1.25
Cost (Ksh)
4500
c. Battery (Dry cell)
Table 3. Battery characteristics
Battery capacity
250 Ah
Voltage (V)
24
Depth of discharge (DOD)
0.8
Efficiency (%)
95
Life span (yrs.)
6
Cost (Ksh)
9500
237
over a period of time at a specified location is necessary. On the other hand, PV and solar thermal systems
are cheaper compared to DG over extended use as
noted by (8) under reasonable site of solar insolation.
Economic and energy analysis was carried by (9) in
order to evaluate the application of the building integrated PV system. Economic examination by (10) and
(11) of energy mix of DG and PV systems for a school
in India and East Malaysia respectively based on life
cycle cost (LCC) concluded that stand-alone PV system is suitable for use when energy demands are low.
Recent studies considering economic aspects of standalone PV systems were investigated in the literature;
(12–15).
Economic analysis of PV system has seen a number of studies done but further research are justifiable
because many of the works did not validate with
experimental results. In addition, updated analysis is
required by customers of PV systems to know if their
investment is still profitable with changing times. This
present study is aimed at analyzing the economic viability and potential of stand-alone solar PV power
through life cycle cost analysis method for a residential
home in western Kenya.
2 DESIGN AND METHODOLOGY
2.1 System configuration
Configuration of a PV system under this study with
complete components is as shown in Figure 1, wired
together to supply electricity to the various load’s (DC
and AC) power rating presented in Table 1. The PV
cell converts sunlight directly to electricity. The charge
controller prevents battery from being overcharged or
over discharged. The inverter converts DC voltage to
AC voltage. The battery stores electrical energy for use
during night and non-sun days.
Figure 1. Configuration of a stand-alone PV system.
2.1.1 Meteorological data
The residential home PV system is located in Kenya, a
location which has a geographical position of latitude
and longitude of 0.42 N and 35.03 E respectively. The
location receives an average solar insolation of 5.35
(kWh/m
2 /day).
2.1.2 Component characteristics
Presented in this section are individual component
properties of a residential PV system. Table 1 shows
the specification of the installed PV module.
a. PV module
Table 1. PV module characteristics
Item
Specifications
Performance warranty (yrs)
25
Cell type
Poly silicon
Cell size (mm)
156 × 104 × 36
Open–Circuit Voltage,
21.9
V oc (V)
Short-Circuit Current,
6.13
I SC (A)
DC bus voltage (V)
24
Module Efficiency (%)
14.63
Max Power, P max (kW)
0.1
Voltage at Maximum Power
18.0
Point, V mpp (V)
Current at Maximum Power
5.56
Point, I mpp (A)
Temperature Coefficients of,
−0.45
P max (%/
◦ C)
Temperature Coefficients of,
−0.32
V oc (%/
◦ C)
Temperature Coefficients of,
+0.04
I SC (%/
◦ C)
Series Fuse Rating (AM)
10:00
Power Tolerance (%)
0%, +6
Cost (Ksh)
9000
b. Charge controller
Table 2. Charge controller characteristics
Battery voltage (V)
12–24
Maximum input voltage (V)
24
Maximum current output (A)
20
Efficiency (%)
95%
Safety factor (SF)
1.25
Cost (Ksh)
4500
c. Battery (Dry cell)
Table 3. Battery characteristics
Battery capacity
250 Ah
Voltage (V)
24
Depth of discharge (DOD)
0.8
Efficiency (%)
95
Life span (yrs.)
6
Cost (Ksh)
9500
237