

Figure 1. Cotton yarn waste sample.
knitting, and cutting waste) proper utilization via biogas production. However, to the best of our knowledge,
no study focused on CYW to produce biogas. The
objective of this research was therefore to investigate
the potential of procuring biogas from CYW using an
anaerobic batch digestion process.
2 MATERIALS AND METHODS
The CYW was the substrate used in this study. CYW
were collected from Rivatex Eastern Africa Ltd, Kenya
while fresh cow manure used as inoculum was collected from a farm at Moi University, Eldoret, Kenya.
The CYW was cut into small pieces using a pair of
scissors to facilitate biodegradability (Wang, 2010)
and kept in the laboratory for one week (Figure 1).
Measured 20% of the total volume of the working
reactor was used as inoculum. The inoculum was kept
in the refrigerator at 4
◦ for two days and was used
without any further treatment. The physicochemical
properties of CYW and inoculum were characterized
before digestion and the mixtures loaded were prepared according to those characterizations. The TS,
VS, and MC were analysed according to standard
Methods 2540 (ALPHA, 2012). Kheldahl method was
used to determine the total nitrogen content. Total carbon analysis was determined using the Walkey-Black
potassium dichromate method (Bakr & El-ashry, 2018;
MYOVELA, 2018). The pH was analysed using PH009 (I) A (pen-type pH meter). The experiment was
carried out in batch type laboratory-scale reactors at
Chemical and Process Engineering Laboratory, Moi
University, Kenya between December 2019 and May
2020.
The reactors of 2 liters’ total volume, 12 cm of
diameter, and 25 cm height each made of aspiration
plastic bottles were used for biogas production (Hasanzadeh et al., 2018). All the reactors with 50% working
volume (1 kg) were run concurrently. These reactors
were closed with suitable rubber plugs and some holes
were dispersedly drilled in the center of the plug for
water displacement and biogas collection. The flexible
rubber piper and syringes were used to pass water in
and out of the conical flask (1000 mL) for displaced
water measurements. The reactor was sealed and then
arranged for the entire setup. Fresh CYW were mixed
with inoculum (needed only at initial state), fed to the
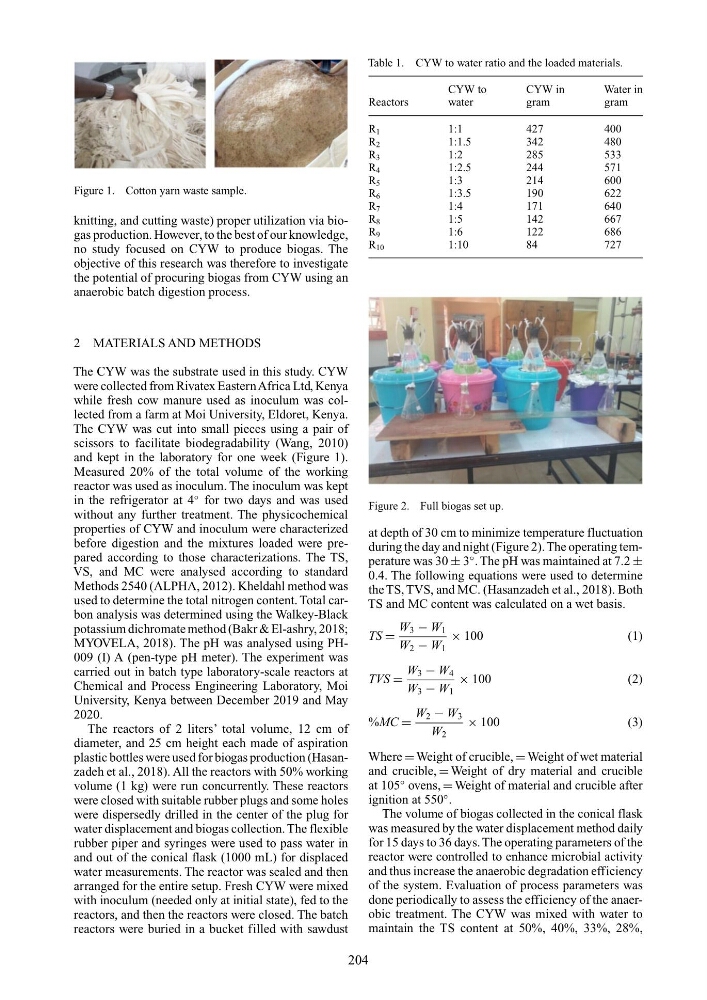
reactors, and then the reactors were closed. The batch
reactors were buried in a bucket filled with sawdust
Table 1. CYW to water ratio and the loaded materials.
CYW to
CYW in
Water in
Reactors
water
gram
gram
R 1
1:1
427
400
R 2
1:1.5
342
480
R 3
1:2
285
533
R 4
1:2.5
244
571
R 5
1:3
214
600
R 6
1:3.5
190
622
R 7
1:4
171
640
R 8
1:5
142
667
R 9
1:6
122
686
R 10
1:10
84
727
Figure 2. Full biogas set up.
at depth of 30 cm to minimize temperature fluctuation
during the day and night (Figure 2). The operating temperature was 30 ± 3
◦ . The pH was maintained at 7.2 ±
0.4. The following equations were used to determine
the TS, TVS, and MC. (Hasanzadeh et al., 2018). Both
TS and MC content was calculated on a wet basis.
TS =
W 3 − W 1
W 2 − W 1
× 100
(1)
TVS =
W 3 − W 4
W 3 − W 1
× 100
(2)
%MC =
W 2 − W 3
W 2
× 100
(3)
Where = Weight of crucible, = Weight of wet material
and crucible, = Weight of dry material and crucible
at 105
◦ ovens, = Weight of material and crucible after
ignition at 550
◦ .
The volume of biogas collected in the conical flask
was measured by the water displacement method daily
for 15 days to 36 days. The operating parameters of the
reactor were controlled to enhance microbial activity
and thus increase the anaerobic degradation efficiency
of the system. Evaluation of process parameters was
done periodically to assess the efficiency of the anaerobic treatment. The CYW was mixed with water to
maintain the TS content at 50%, 40%, 33%, 28%,
204
knitting, and cutting waste) proper utilization via biogas production. However, to the best of our knowledge,
no study focused on CYW to produce biogas. The
objective of this research was therefore to investigate
the potential of procuring biogas from CYW using an
anaerobic batch digestion process.
2 MATERIALS AND METHODS
The CYW was the substrate used in this study. CYW
were collected from Rivatex Eastern Africa Ltd, Kenya
while fresh cow manure used as inoculum was collected from a farm at Moi University, Eldoret, Kenya.
The CYW was cut into small pieces using a pair of
scissors to facilitate biodegradability (Wang, 2010)
and kept in the laboratory for one week (Figure 1).
Measured 20% of the total volume of the working
reactor was used as inoculum. The inoculum was kept
in the refrigerator at 4
◦ for two days and was used
without any further treatment. The physicochemical
properties of CYW and inoculum were characterized
before digestion and the mixtures loaded were prepared according to those characterizations. The TS,
VS, and MC were analysed according to standard
Methods 2540 (ALPHA, 2012). Kheldahl method was
used to determine the total nitrogen content. Total carbon analysis was determined using the Walkey-Black
potassium dichromate method (Bakr & El-ashry, 2018;
MYOVELA, 2018). The pH was analysed using PH009 (I) A (pen-type pH meter). The experiment was
carried out in batch type laboratory-scale reactors at
Chemical and Process Engineering Laboratory, Moi
University, Kenya between December 2019 and May
2020.
The reactors of 2 liters’ total volume, 12 cm of
diameter, and 25 cm height each made of aspiration
plastic bottles were used for biogas production (Hasanzadeh et al., 2018). All the reactors with 50% working
volume (1 kg) were run concurrently. These reactors
were closed with suitable rubber plugs and some holes
were dispersedly drilled in the center of the plug for
water displacement and biogas collection. The flexible
rubber piper and syringes were used to pass water in
and out of the conical flask (1000 mL) for displaced
water measurements. The reactor was sealed and then
arranged for the entire setup. Fresh CYW were mixed
with inoculum (needed only at initial state), fed to the
reactors, and then the reactors were closed. The batch
reactors were buried in a bucket filled with sawdust
Table 1. CYW to water ratio and the loaded materials.
CYW to
CYW in
Water in
Reactors
water
gram
gram
R 1
1:1
427
400
R 2
1:1.5
342
480
R 3
1:2
285
533
R 4
1:2.5
244
571
R 5
1:3
214
600
R 6
1:3.5
190
622
R 7
1:4
171
640
R 8
1:5
142
667
R 9
1:6
122
686
R 10
1:10
84
727
Figure 2. Full biogas set up.
at depth of 30 cm to minimize temperature fluctuation
during the day and night (Figure 2). The operating temperature was 30 ± 3
◦ . The pH was maintained at 7.2 ±
0.4. The following equations were used to determine
the TS, TVS, and MC. (Hasanzadeh et al., 2018). Both
TS and MC content was calculated on a wet basis.
TS =
W 3 − W 1
W 2 − W 1
× 100
(1)
TVS =
W 3 − W 4
W 3 − W 1
× 100
(2)
%MC =
W 2 − W 3
W 2
× 100
(3)
Where = Weight of crucible, = Weight of wet material
and crucible, = Weight of dry material and crucible
at 105
◦ ovens, = Weight of material and crucible after
ignition at 550
◦ .
The volume of biogas collected in the conical flask
was measured by the water displacement method daily
for 15 days to 36 days. The operating parameters of the
reactor were controlled to enhance microbial activity
and thus increase the anaerobic degradation efficiency
of the system. Evaluation of process parameters was
done periodically to assess the efficiency of the anaerobic treatment. The CYW was mixed with water to
maintain the TS content at 50%, 40%, 33%, 28%,
204