

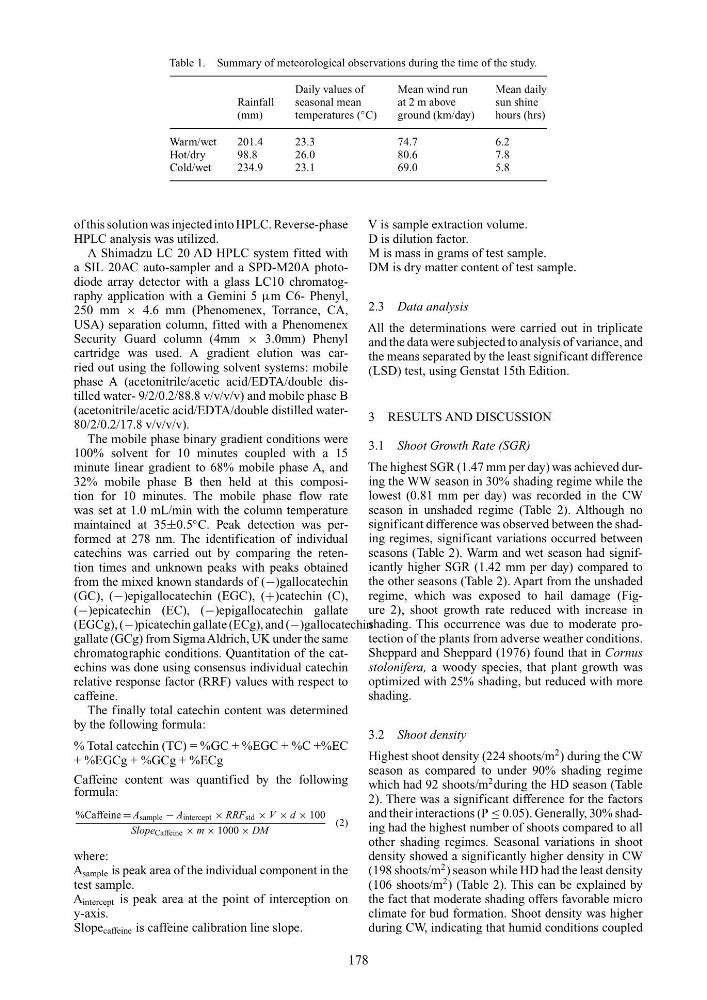
Table 1. Summary of meteorological observations during the time of the study.
Daily values of
Mean wind run
Mean daily
Rainfall
seasonal mean
at 2 m above
sun shine
(mm)
temperatures (
◦ C)
ground (km/day)
hours (hrs)
Warm/wet
201.4
23.3
74.7
6.2
Hot/dry
98.8
26.0
80.6
7.8
Cold/wet
234.9
23.1
69.0
5.8
of this solution was injected into HPLC. Reverse-phase
HPLC analysis was utilized.
A Shimadzu LC 20 AD HPLC system fitted with
a SIL 20AC auto-sampler and a SPD-M20A photodiode array detector with a glass LC10 chromatography application with a Gemini 5 µm C6- Phenyl,
250 mm × 4.6 mm (Phenomenex, Torrance, CA,
USA) separation column, fitted with a Phenomenex
Security Guard column (4mm × 3.0mm) Phenyl
cartridge was used. A gradient elution was carried out using the following solvent systems: mobile
phase A (acetonitrile/acetic acid/EDTA/double distilled water- 9/2/0.2/88.8 v/v/v/v) and mobile phase B
(acetonitrile/acetic acid/EDTA/double distilled water80/2/0.2/17.8 v/v/v/v).
The mobile phase binary gradient conditions were
100% solvent for 10 minutes coupled with a 15
minute linear gradient to 68% mobile phase A, and
32% mobile phase B then held at this composition for 10 minutes. The mobile phase flow rate
was set at 1.0 mL/min with the column temperature
maintained at 35±0.5
◦ C. Peak detection was performed at 278 nm. The identification of individual
catechins was carried out by comparing the retention times and unknown peaks with peaks obtained
from the mixed known standards of (−)gallocatechin
(GC), (−)epigallocatechin (EGC), (+)catechin (C),
(−)epicatechin (EC), (−)epigallocatechin gallate
(EGCg), (−)picatechin gallate (ECg), and (−)gallocatechin
gallate (GCg) from Sigma Aldrich, UK under the same
chromatographic conditions. Quantitation of the catechins was done using consensus individual catechin
relative response factor (RRF) values with respect to
caffeine.
The finally total catechin content was determined
by the following formula:
% Total catechin (TC) = %GC + %EGC + %C +%EC
+ %EGCg + %GCg + %ECg
Caffeine content was quantified by the following
formula:
%Caffeine = A sample − A intercept × RRF std × V × d × 100
Slope Caffeine × m × 1000 × DM
(2)
where:
A sample is peak area of the individual component in the
test sample.
A intercept is peak area at the point of interception on
y-axis.
Slope caffeine is caffeine calibration line slope.
V is sample extraction volume.
D is dilution factor.
M is mass in grams of test sample.
DM is dry matter content of test sample.
2.3 Data analysis
All the determinations were carried out in triplicate
and the data were subjected to analysis of variance, and
the means separated by the least significant difference
(LSD) test, using Genstat 15th Edition.
3 RESULTS AND DISCUSSION
3.1 Shoot Growth Rate (SGR)
The highest SGR (1.47 mm per day) was achieved during the WW season in 30% shading regime while the
lowest (0.81 mm per day) was recorded in the CW
season in unshaded regime (Table 2). Although no
significant difference was observed between the shading regimes, significant variations occurred between
seasons (Table 2). Warm and wet season had significantly higher SGR (1.42 mm per day) compared to
the other seasons (Table 2). Apart from the unshaded
regime, which was exposed to hail damage (Figure 2), shoot growth rate reduced with increase in
shading. This occurrence was due to moderate protection of the plants from adverse weather conditions.
Sheppard and Sheppard (1976) found that in Cornus
stolonifera, a woody species, that plant growth was
optimized with 25% shading, but reduced with more
shading.
3.2 Shoot density
Highest shoot density (224 shoots/m
2 ) during the CW
season as compared to under 90% shading regime
which had 92 shoots/m
2 during the HD season (Table
2). There was a significant difference for the factors
and their interactions (P ≤ 0.05). Generally, 30% shading had the highest number of shoots compared to all
other shading regimes. Seasonal variations in shoot
density showed a significantly higher density in CW
(198 shoots/m
2 ) season while HD had the least density
(106 shoots/m
2 ) (Table 2). This can be explained by
the fact that moderate shading offers favorable micro
climate for bud formation. Shoot density was higher
during CW, indicating that humid conditions coupled
178
Daily values of
Mean wind run
Mean daily
Rainfall
seasonal mean
at 2 m above
sun shine
(mm)
temperatures (
◦ C)
ground (km/day)
hours (hrs)
Warm/wet
201.4
23.3
74.7
6.2
Hot/dry
98.8
26.0
80.6
7.8
Cold/wet
234.9
23.1
69.0
5.8
of this solution was injected into HPLC. Reverse-phase
HPLC analysis was utilized.
A Shimadzu LC 20 AD HPLC system fitted with
a SIL 20AC auto-sampler and a SPD-M20A photodiode array detector with a glass LC10 chromatography application with a Gemini 5 µm C6- Phenyl,
250 mm × 4.6 mm (Phenomenex, Torrance, CA,
USA) separation column, fitted with a Phenomenex
Security Guard column (4mm × 3.0mm) Phenyl
cartridge was used. A gradient elution was carried out using the following solvent systems: mobile
phase A (acetonitrile/acetic acid/EDTA/double distilled water- 9/2/0.2/88.8 v/v/v/v) and mobile phase B
(acetonitrile/acetic acid/EDTA/double distilled water80/2/0.2/17.8 v/v/v/v).
The mobile phase binary gradient conditions were
100% solvent for 10 minutes coupled with a 15
minute linear gradient to 68% mobile phase A, and
32% mobile phase B then held at this composition for 10 minutes. The mobile phase flow rate
was set at 1.0 mL/min with the column temperature
maintained at 35±0.5
◦ C. Peak detection was performed at 278 nm. The identification of individual
catechins was carried out by comparing the retention times and unknown peaks with peaks obtained
from the mixed known standards of (−)gallocatechin
(GC), (−)epigallocatechin (EGC), (+)catechin (C),
(−)epicatechin (EC), (−)epigallocatechin gallate
(EGCg), (−)picatechin gallate (ECg), and (−)gallocatechin
gallate (GCg) from Sigma Aldrich, UK under the same
chromatographic conditions. Quantitation of the catechins was done using consensus individual catechin
relative response factor (RRF) values with respect to
caffeine.
The finally total catechin content was determined
by the following formula:
% Total catechin (TC) = %GC + %EGC + %C +%EC
+ %EGCg + %GCg + %ECg
Caffeine content was quantified by the following
formula:
%Caffeine = A sample − A intercept × RRF std × V × d × 100
Slope Caffeine × m × 1000 × DM
(2)
where:
A sample is peak area of the individual component in the
test sample.
A intercept is peak area at the point of interception on
y-axis.
Slope caffeine is caffeine calibration line slope.
V is sample extraction volume.
D is dilution factor.
M is mass in grams of test sample.
DM is dry matter content of test sample.
2.3 Data analysis
All the determinations were carried out in triplicate
and the data were subjected to analysis of variance, and
the means separated by the least significant difference
(LSD) test, using Genstat 15th Edition.
3 RESULTS AND DISCUSSION
3.1 Shoot Growth Rate (SGR)
The highest SGR (1.47 mm per day) was achieved during the WW season in 30% shading regime while the
lowest (0.81 mm per day) was recorded in the CW
season in unshaded regime (Table 2). Although no
significant difference was observed between the shading regimes, significant variations occurred between
seasons (Table 2). Warm and wet season had significantly higher SGR (1.42 mm per day) compared to
the other seasons (Table 2). Apart from the unshaded
regime, which was exposed to hail damage (Figure 2), shoot growth rate reduced with increase in
shading. This occurrence was due to moderate protection of the plants from adverse weather conditions.
Sheppard and Sheppard (1976) found that in Cornus
stolonifera, a woody species, that plant growth was
optimized with 25% shading, but reduced with more
shading.
3.2 Shoot density
Highest shoot density (224 shoots/m
2 ) during the CW
season as compared to under 90% shading regime
which had 92 shoots/m
2 during the HD season (Table
2). There was a significant difference for the factors
and their interactions (P ≤ 0.05). Generally, 30% shading had the highest number of shoots compared to all
other shading regimes. Seasonal variations in shoot
density showed a significantly higher density in CW
(198 shoots/m
2 ) season while HD had the least density
(106 shoots/m
2 ) (Table 2). This can be explained by
the fact that moderate shading offers favorable micro
climate for bud formation. Shoot density was higher
during CW, indicating that humid conditions coupled
178