

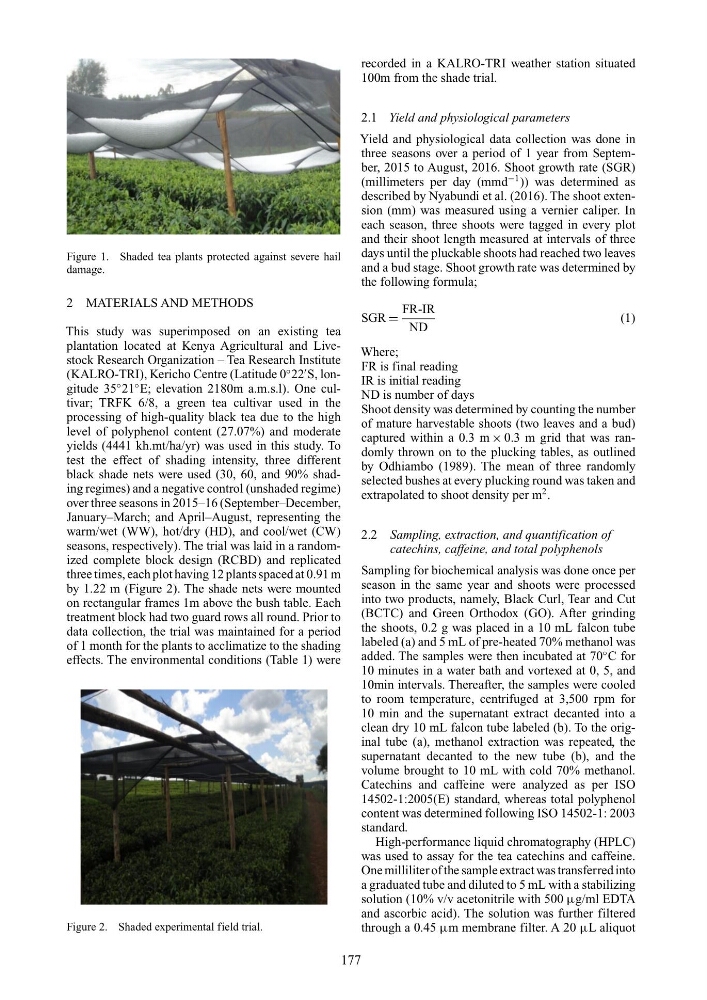
Figure 1. Shaded tea plants protected against severe hail
damage.
2 MATERIALS AND METHODS
This study was superimposed on an existing tea
plantation located at Kenya Agricultural and Livestock Research Organization – Tea Research Institute
(KALRO-TRI), Kericho Centre (Latitude 0
◦ 22
S, longitude 35
◦ 21
◦ E; elevation 2180m a.m.s.l). One cultivar; TRFK 6/8, a green tea cultivar used in the
processing of high-quality black tea due to the high
level of polyphenol content (27.07%) and moderate
yields (4441 kh.mt/ha/yr) was used in this study. To
test the effect of shading intensity, three different
black shade nets were used (30, 60, and 90% shading regimes) and a negative control (unshaded regime)
over three seasons in 2015–16 (September–December,
January–March; and April–August, representing the
warm/wet (WW), hot/dry (HD), and cool/wet (CW)
seasons, respectively). The trial was laid in a randomized complete block design (RCBD) and replicated
three times, each plot having 12 plants spaced at 0.91 m
by 1.22 m (Figure 2). The shade nets were mounted
on rectangular frames 1m above the bush table. Each
treatment block had two guard rows all round. Prior to
data collection, the trial was maintained for a period
of 1 month for the plants to acclimatize to the shading
effects. The environmental conditions (Table 1) were
Figure 2. Shaded experimental field trial.
recorded in a KALRO-TRI weather station situated
100m from the shade trial.
2.1 Yield and physiological parameters
Yield and physiological data collection was done in
three seasons over a period of 1 year from September, 2015 to August, 2016. Shoot growth rate (SGR)
(millimeters per day (mmd
−1 )) was determined as
described by Nyabundi et al. (2016). The shoot extension (mm) was measured using a vernier caliper. In
each season, three shoots were tagged in every plot
and their shoot length measured at intervals of three
days until the pluckable shoots had reached two leaves
and a bud stage. Shoot growth rate was determined by
the following formula;
SGR =
FR-IR
ND
(1)
Where;
FR is final reading
IR is initial reading
ND is number of days
Shoot density was determined by counting the number
of mature harvestable shoots (two leaves and a bud)
captured within a 0.3 m × 0.3 m grid that was randomly thrown on to the plucking tables, as outlined
by Odhiambo (1989). The mean of three randomly
selected bushes at every plucking round was taken and
extrapolated to shoot density per m
2 .
2.2 Sampling, extraction, and quantification of
catechins, caffeine, and total polyphenols
Sampling for biochemical analysis was done once per
season in the same year and shoots were processed
into two products, namely, Black Curl, Tear and Cut
(BCTC) and Green Orthodox (GO). After grinding
the shoots, 0.2 g was placed in a 10 mL falcon tube
labeled (a) and 5 mL of pre-heated 70% methanol was
added. The samples were then incubated at 70
◦ C for
10 minutes in a water bath and vortexed at 0, 5, and
10min intervals. Thereafter, the samples were cooled
to room temperature, centrifuged at 3,500 rpm for
10 min and the supernatant extract decanted into a
clean dry 10 mL falcon tube labeled (b). To the original tube (a), methanol extraction was repeated, the
supernatant decanted to the new tube (b), and the
volume brought to 10 mL with cold 70% methanol.
Catechins and caffeine were analyzed as per ISO
14502-1:2005(E) standard, whereas total polyphenol
content was determined following ISO 14502-1: 2003
standard.
High-performance liquid chromatography (HPLC)
was used to assay for the tea catechins and caffeine.
One milliliter of the sample extract was transferred into
a graduated tube and diluted to 5 mL with a stabilizing
solution (10% v/v acetonitrile with 500 µg/ml EDTA
and ascorbic acid). The solution was further filtered
through a 0.45 µm membrane filter. A 20 µL aliquot
177
damage.
2 MATERIALS AND METHODS
This study was superimposed on an existing tea
plantation located at Kenya Agricultural and Livestock Research Organization – Tea Research Institute
(KALRO-TRI), Kericho Centre (Latitude 0
◦ 22
S, longitude 35
◦ 21
◦ E; elevation 2180m a.m.s.l). One cultivar; TRFK 6/8, a green tea cultivar used in the
processing of high-quality black tea due to the high
level of polyphenol content (27.07%) and moderate
yields (4441 kh.mt/ha/yr) was used in this study. To
test the effect of shading intensity, three different
black shade nets were used (30, 60, and 90% shading regimes) and a negative control (unshaded regime)
over three seasons in 2015–16 (September–December,
January–March; and April–August, representing the
warm/wet (WW), hot/dry (HD), and cool/wet (CW)
seasons, respectively). The trial was laid in a randomized complete block design (RCBD) and replicated
three times, each plot having 12 plants spaced at 0.91 m
by 1.22 m (Figure 2). The shade nets were mounted
on rectangular frames 1m above the bush table. Each
treatment block had two guard rows all round. Prior to
data collection, the trial was maintained for a period
of 1 month for the plants to acclimatize to the shading
effects. The environmental conditions (Table 1) were
Figure 2. Shaded experimental field trial.
recorded in a KALRO-TRI weather station situated
100m from the shade trial.
2.1 Yield and physiological parameters
Yield and physiological data collection was done in
three seasons over a period of 1 year from September, 2015 to August, 2016. Shoot growth rate (SGR)
(millimeters per day (mmd
−1 )) was determined as
described by Nyabundi et al. (2016). The shoot extension (mm) was measured using a vernier caliper. In
each season, three shoots were tagged in every plot
and their shoot length measured at intervals of three
days until the pluckable shoots had reached two leaves
and a bud stage. Shoot growth rate was determined by
the following formula;
SGR =
FR-IR
ND
(1)
Where;
FR is final reading
IR is initial reading
ND is number of days
Shoot density was determined by counting the number
of mature harvestable shoots (two leaves and a bud)
captured within a 0.3 m × 0.3 m grid that was randomly thrown on to the plucking tables, as outlined
by Odhiambo (1989). The mean of three randomly
selected bushes at every plucking round was taken and
extrapolated to shoot density per m
2 .
2.2 Sampling, extraction, and quantification of
catechins, caffeine, and total polyphenols
Sampling for biochemical analysis was done once per
season in the same year and shoots were processed
into two products, namely, Black Curl, Tear and Cut
(BCTC) and Green Orthodox (GO). After grinding
the shoots, 0.2 g was placed in a 10 mL falcon tube
labeled (a) and 5 mL of pre-heated 70% methanol was
added. The samples were then incubated at 70
◦ C for
10 minutes in a water bath and vortexed at 0, 5, and
10min intervals. Thereafter, the samples were cooled
to room temperature, centrifuged at 3,500 rpm for
10 min and the supernatant extract decanted into a
clean dry 10 mL falcon tube labeled (b). To the original tube (a), methanol extraction was repeated, the
supernatant decanted to the new tube (b), and the
volume brought to 10 mL with cold 70% methanol.
Catechins and caffeine were analyzed as per ISO
14502-1:2005(E) standard, whereas total polyphenol
content was determined following ISO 14502-1: 2003
standard.
High-performance liquid chromatography (HPLC)
was used to assay for the tea catechins and caffeine.
One milliliter of the sample extract was transferred into
a graduated tube and diluted to 5 mL with a stabilizing
solution (10% v/v acetonitrile with 500 µg/ml EDTA
and ascorbic acid). The solution was further filtered
through a 0.45 µm membrane filter. A 20 µL aliquot
177