

of the extracts with 2.5 mL of 10% Folin–Coicalteu
reagent dissolved in distilled water with 2.5 mL of
7.5% NaHCO 3 . The samples were prepared in triplicate. Blanks were also prepared with 50% methanol,
2.5 mL of 10% Folin–Coicalteu reagent dissolved in
distilled water and 7.5% of NaHCO 3 . The samples
were then incubated for 45 minutes at a temperature
of 45
◦ C and the absorbance was measured at 770 nm.
Standard solutions of gallic acid were also used
for the calibration line. Based on the measured
absorbance, the total phenolic content was measured
in gallic acid equivalent (mg of GAE/100g of extract).
This was calculated using the formula below:
T.P.C = Df
CV
M
(1)
where C is the concentration of gallic acid established
from the calibration curve, mg/mL; V is the volume of
the extract used; and M is the mass of the extract.
3.4.8 Total flavonoid content
The procedure for total flavonoid content was as
described by Odero et al. (Odero et al., 2017), with
some modifications. Approximately 0.25 grams of
each of the dyes was taken and dissolved in 1.25 mL
of distilled water 75 µL of 6% NaNO 3 was added
and the solution was shaken together to mix. It was
then incubated in a dark oven at room temperature for
approximately 6 minutes.
A solution of 10% AlCl 3 , was then added and the
mixture was incubated further in a dark cabinet for 5
minutes. A calibration curve of the standard quercetin
at concentrations of 0, 20, 40,60, 80 and 100 µg/mL
diluted in methanol. The absorbance was measured at
510 nm λ max using Beckman Coulter Model DU
R 720
UV–Vis and the results were obtained in triplicate.
The total flavonoid content was calculated using the
formula:
TFC =
Absorbance of crude extracts x Mass of quercetin in Mg
Absorbance of standards xmass of extracts in Mg
(2)
3.4.9 GC-MS
The crude extracts of both dyes were initially extracted
using C-18 Solid Phase Extraction cartridges and filtered through 0.45 µm syringe filters. They were then
transferred into auto-sampler vials for GC-MS Shimadzu QP 2010 Model for further analysis. The carrier
gas used was ultrapure helium with the flow rate set
at 1 mL/minute. A BP-X5 non-polar column, 30m;
0.25 mm ID; 0.25 µm film thickness, was used for
separation.
The GC-MS machine was set and programmed as
follows: temperature of 50
◦ C (1 minute). This was subsequently increased at a rate of 5
◦ C/min up to 250
◦ C (9
minutes) with the total run-time being exactly 50 minutes. One microliter of the sample was injected into the
GC at 200
◦ C in split mode. This was in split ratios of
10:1 with the interface temperatures set at 250
◦ C. The
Electron Ionization (E.I) ion source was set at 200
◦ C.
Mass analysis was done in full scan mode within
the ranges 50–600 m/z and the detected peaks matched
Table 1. Phytochemical screening of acetonic extracts of
the heartwood of P. juliflora.
Phytochemical components
Results
Terpenoids
+
Saponins
_
Tannins
+
Alkaloids
+
Flavonoids
+
Steroids
+
Key: +: present –: absent.
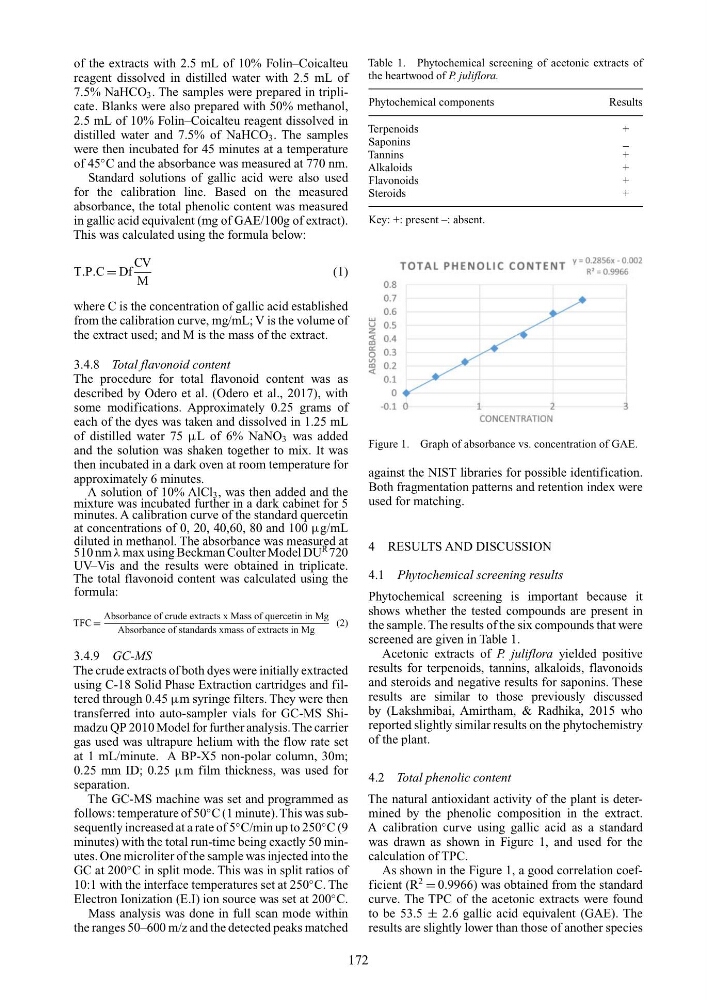
Figure 1. Graph of absorbance vs. concentration of GAE.
against the NIST libraries for possible identification.
Both fragmentation patterns and retention index were
used for matching.
4 RESULTS AND DISCUSSION
4.1 Phytochemical screening results
Phytochemical screening is important because it
shows whether the tested compounds are present in
the sample. The results of the six compounds that were
screened are given in Table 1.
Acetonic extracts of P. juliflora yielded positive
results for terpenoids, tannins, alkaloids, flavonoids
and steroids and negative results for saponins. These
results are similar to those previously discussed
by (Lakshmibai, Amirtham, & Radhika, 2015 who
reported slightly similar results on the phytochemistry
of the plant.
4.2 Total phenolic content
The natural antioxidant activity of the plant is determined by the phenolic composition in the extract.
A calibration curve using gallic acid as a standard
was drawn as shown in Figure 1, and used for the
calculation of TPC.
As shown in the Figure 1, a good correlation coefficient (R
2
= 0.9966) was obtained from the standard
curve. The TPC of the acetonic extracts were found
to be 53.5 ± 2.6 gallic acid equivalent (GAE). The
results are slightly lower than those of another species
172
reagent dissolved in distilled water with 2.5 mL of
7.5% NaHCO 3 . The samples were prepared in triplicate. Blanks were also prepared with 50% methanol,
2.5 mL of 10% Folin–Coicalteu reagent dissolved in
distilled water and 7.5% of NaHCO 3 . The samples
were then incubated for 45 minutes at a temperature
of 45
◦ C and the absorbance was measured at 770 nm.
Standard solutions of gallic acid were also used
for the calibration line. Based on the measured
absorbance, the total phenolic content was measured
in gallic acid equivalent (mg of GAE/100g of extract).
This was calculated using the formula below:
T.P.C = Df
CV
M
(1)
where C is the concentration of gallic acid established
from the calibration curve, mg/mL; V is the volume of
the extract used; and M is the mass of the extract.
3.4.8 Total flavonoid content
The procedure for total flavonoid content was as
described by Odero et al. (Odero et al., 2017), with
some modifications. Approximately 0.25 grams of
each of the dyes was taken and dissolved in 1.25 mL
of distilled water 75 µL of 6% NaNO 3 was added
and the solution was shaken together to mix. It was
then incubated in a dark oven at room temperature for
approximately 6 minutes.
A solution of 10% AlCl 3 , was then added and the
mixture was incubated further in a dark cabinet for 5
minutes. A calibration curve of the standard quercetin
at concentrations of 0, 20, 40,60, 80 and 100 µg/mL
diluted in methanol. The absorbance was measured at
510 nm λ max using Beckman Coulter Model DU
R 720
UV–Vis and the results were obtained in triplicate.
The total flavonoid content was calculated using the
formula:
TFC =
Absorbance of crude extracts x Mass of quercetin in Mg
Absorbance of standards xmass of extracts in Mg
(2)
3.4.9 GC-MS
The crude extracts of both dyes were initially extracted
using C-18 Solid Phase Extraction cartridges and filtered through 0.45 µm syringe filters. They were then
transferred into auto-sampler vials for GC-MS Shimadzu QP 2010 Model for further analysis. The carrier
gas used was ultrapure helium with the flow rate set
at 1 mL/minute. A BP-X5 non-polar column, 30m;
0.25 mm ID; 0.25 µm film thickness, was used for
separation.
The GC-MS machine was set and programmed as
follows: temperature of 50
◦ C (1 minute). This was subsequently increased at a rate of 5
◦ C/min up to 250
◦ C (9
minutes) with the total run-time being exactly 50 minutes. One microliter of the sample was injected into the
GC at 200
◦ C in split mode. This was in split ratios of
10:1 with the interface temperatures set at 250
◦ C. The
Electron Ionization (E.I) ion source was set at 200
◦ C.
Mass analysis was done in full scan mode within
the ranges 50–600 m/z and the detected peaks matched
Table 1. Phytochemical screening of acetonic extracts of
the heartwood of P. juliflora.
Phytochemical components
Results
Terpenoids
+
Saponins
_
Tannins
+
Alkaloids
+
Flavonoids
+
Steroids
+
Key: +: present –: absent.
Figure 1. Graph of absorbance vs. concentration of GAE.
against the NIST libraries for possible identification.
Both fragmentation patterns and retention index were
used for matching.
4 RESULTS AND DISCUSSION
4.1 Phytochemical screening results
Phytochemical screening is important because it
shows whether the tested compounds are present in
the sample. The results of the six compounds that were
screened are given in Table 1.
Acetonic extracts of P. juliflora yielded positive
results for terpenoids, tannins, alkaloids, flavonoids
and steroids and negative results for saponins. These
results are similar to those previously discussed
by (Lakshmibai, Amirtham, & Radhika, 2015 who
reported slightly similar results on the phytochemistry
of the plant.
4.2 Total phenolic content
The natural antioxidant activity of the plant is determined by the phenolic composition in the extract.
A calibration curve using gallic acid as a standard
was drawn as shown in Figure 1, and used for the
calculation of TPC.
As shown in the Figure 1, a good correlation coefficient (R
2
= 0.9966) was obtained from the standard
curve. The TPC of the acetonic extracts were found
to be 53.5 ± 2.6 gallic acid equivalent (GAE). The
results are slightly lower than those of another species
172