

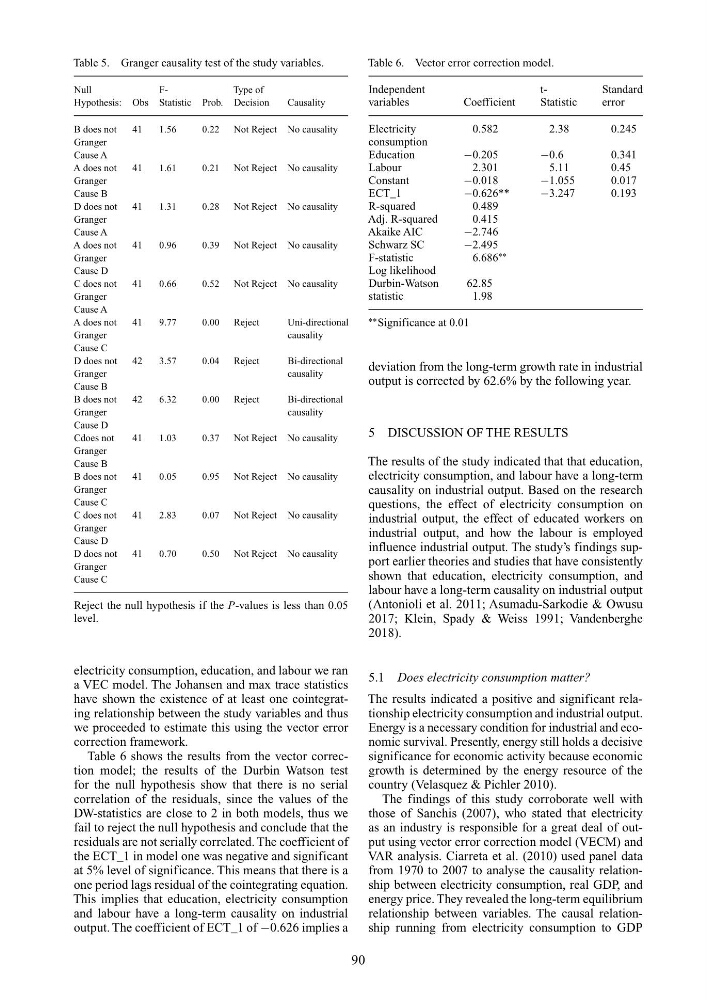
Table 5. Granger causality test of the study variables.
Null
FType of
Hypothesis: Obs Statistic Prob. Decision
Causality
B does not
41
1.56
0.22 Not Reject No causality
Granger
Cause A
A does not
41
1.61
0.21 Not Reject No causality
Granger
Cause B
D does not
41
1.31
0.28 Not Reject No causality
Granger
Cause A
A does not
41
0.96
0.39 Not Reject No causality
Granger
Cause D
C does not
41
0.66
0.52 Not Reject No causality
Granger
Cause A
A does not
41
9.77
0.00 Reject
Uni-directional
Granger
causality
Cause C
D does not
42
3.57
0.04 Reject
Bi-directional
Granger
causality
Cause B
B does not
42
6.32
0.00 Reject
Bi-directional
Granger
causality
Cause D
Cdoes not
41
1.03
0.37 Not Reject No causality
Granger
Cause B
B does not
41
0.05
0.95 Not Reject No causality
Granger
Cause C
C does not
41
2.83
0.07 Not Reject No causality
Granger
Cause D
D does not
41
0.70
0.50 Not Reject No causality
Granger
Cause C
Reject the null hypothesis if the P-values is less than 0.05
level.
electricity consumption, education, and labour we ran
a VEC model. The Johansen and max trace statistics
have shown the existence of at least one cointegrating relationship between the study variables and thus
we proceeded to estimate this using the vector error
correction framework.
Table 6 shows the results from the vector correction model; the results of the Durbin Watson test
for the null hypothesis show that there is no serial
correlation of the residuals, since the values of the
DW-statistics are close to 2 in both models, thus we
fail to reject the null hypothesis and conclude that the
residuals are not serially correlated. The coefficient of
the ECT_1 in model one was negative and significant
at 5% level of significance. This means that there is a
one period lags residual of the cointegrating equation.
This implies that education, electricity consumption
and labour have a long-term causality on industrial
output. The coefficient of ECT_1 of −0.626 implies a
Table 6. Vector error correction model.
Independent
tStandard
variables
Coefficient
Statistic
error
Electricity
0.582
2.38
0.245
consumption
Education
−0.205
−0.6
0.341
Labour
2.301
5.11
0.45
Constant
−0.018
−1.055
0.017
ECT_1
−0.626**
−3.247
0.193
R-squared
0.489
Adj. R-squared
0.415
Akaike AIC
−2.746
Schwarz SC
−2.495
F-statistic
6.686
∗∗
Log likelihood
Durbin-Watson
62.85
statistic
1.98
∗∗ Significance at 0.01
deviation from the long-term growth rate in industrial
output is corrected by 62.6% by the following year.
5 DISCUSSION OF THE RESULTS
The results of the study indicated that that education,
electricity consumption, and labour have a long-term
causality on industrial output. Based on the research
questions, the effect of electricity consumption on
industrial output, the effect of educated workers on
industrial output, and how the labour is employed
influence industrial output. The study’s findings support earlier theories and studies that have consistently
shown that education, electricity consumption, and
labour have a long-term causality on industrial output
(Antonioli et al. 2011; Asumadu-Sarkodie & Owusu
2017; Klein, Spady & Weiss 1991; Vandenberghe
2018).
5.1 Does electricity consumption matter?
The results indicated a positive and significant relationship electricity consumption and industrial output.
Energy is a necessary condition for industrial and economic survival. Presently, energy still holds a decisive
significance for economic activity because economic
growth is determined by the energy resource of the
country (Velasquez & Pichler 2010).
The findings of this study corroborate well with
those of Sanchis (2007), who stated that electricity
as an industry is responsible for a great deal of output using vector error correction model (VECM) and
VAR analysis. Ciarreta et al. (2010) used panel data
from 1970 to 2007 to analyse the causality relationship between electricity consumption, real GDP, and
energy price. They revealed the long-term equilibrium
relationship between variables. The causal relationship running from electricity consumption to GDP
90
Null
FType of
Hypothesis: Obs Statistic Prob. Decision
Causality
B does not
41
1.56
0.22 Not Reject No causality
Granger
Cause A
A does not
41
1.61
0.21 Not Reject No causality
Granger
Cause B
D does not
41
1.31
0.28 Not Reject No causality
Granger
Cause A
A does not
41
0.96
0.39 Not Reject No causality
Granger
Cause D
C does not
41
0.66
0.52 Not Reject No causality
Granger
Cause A
A does not
41
9.77
0.00 Reject
Uni-directional
Granger
causality
Cause C
D does not
42
3.57
0.04 Reject
Bi-directional
Granger
causality
Cause B
B does not
42
6.32
0.00 Reject
Bi-directional
Granger
causality
Cause D
Cdoes not
41
1.03
0.37 Not Reject No causality
Granger
Cause B
B does not
41
0.05
0.95 Not Reject No causality
Granger
Cause C
C does not
41
2.83
0.07 Not Reject No causality
Granger
Cause D
D does not
41
0.70
0.50 Not Reject No causality
Granger
Cause C
Reject the null hypothesis if the P-values is less than 0.05
level.
electricity consumption, education, and labour we ran
a VEC model. The Johansen and max trace statistics
have shown the existence of at least one cointegrating relationship between the study variables and thus
we proceeded to estimate this using the vector error
correction framework.
Table 6 shows the results from the vector correction model; the results of the Durbin Watson test
for the null hypothesis show that there is no serial
correlation of the residuals, since the values of the
DW-statistics are close to 2 in both models, thus we
fail to reject the null hypothesis and conclude that the
residuals are not serially correlated. The coefficient of
the ECT_1 in model one was negative and significant
at 5% level of significance. This means that there is a
one period lags residual of the cointegrating equation.
This implies that education, electricity consumption
and labour have a long-term causality on industrial
output. The coefficient of ECT_1 of −0.626 implies a
Table 6. Vector error correction model.
Independent
tStandard
variables
Coefficient
Statistic
error
Electricity
0.582
2.38
0.245
consumption
Education
−0.205
−0.6
0.341
Labour
2.301
5.11
0.45
Constant
−0.018
−1.055
0.017
ECT_1
−0.626**
−3.247
0.193
R-squared
0.489
Adj. R-squared
0.415
Akaike AIC
−2.746
Schwarz SC
−2.495
F-statistic
6.686
∗∗
Log likelihood
Durbin-Watson
62.85
statistic
1.98
∗∗ Significance at 0.01
deviation from the long-term growth rate in industrial
output is corrected by 62.6% by the following year.
5 DISCUSSION OF THE RESULTS
The results of the study indicated that that education,
electricity consumption, and labour have a long-term
causality on industrial output. Based on the research
questions, the effect of electricity consumption on
industrial output, the effect of educated workers on
industrial output, and how the labour is employed
influence industrial output. The study’s findings support earlier theories and studies that have consistently
shown that education, electricity consumption, and
labour have a long-term causality on industrial output
(Antonioli et al. 2011; Asumadu-Sarkodie & Owusu
2017; Klein, Spady & Weiss 1991; Vandenberghe
2018).
5.1 Does electricity consumption matter?
The results indicated a positive and significant relationship electricity consumption and industrial output.
Energy is a necessary condition for industrial and economic survival. Presently, energy still holds a decisive
significance for economic activity because economic
growth is determined by the energy resource of the
country (Velasquez & Pichler 2010).
The findings of this study corroborate well with
those of Sanchis (2007), who stated that electricity
as an industry is responsible for a great deal of output using vector error correction model (VECM) and
VAR analysis. Ciarreta et al. (2010) used panel data
from 1970 to 2007 to analyse the causality relationship between electricity consumption, real GDP, and
energy price. They revealed the long-term equilibrium
relationship between variables. The causal relationship running from electricity consumption to GDP
90