

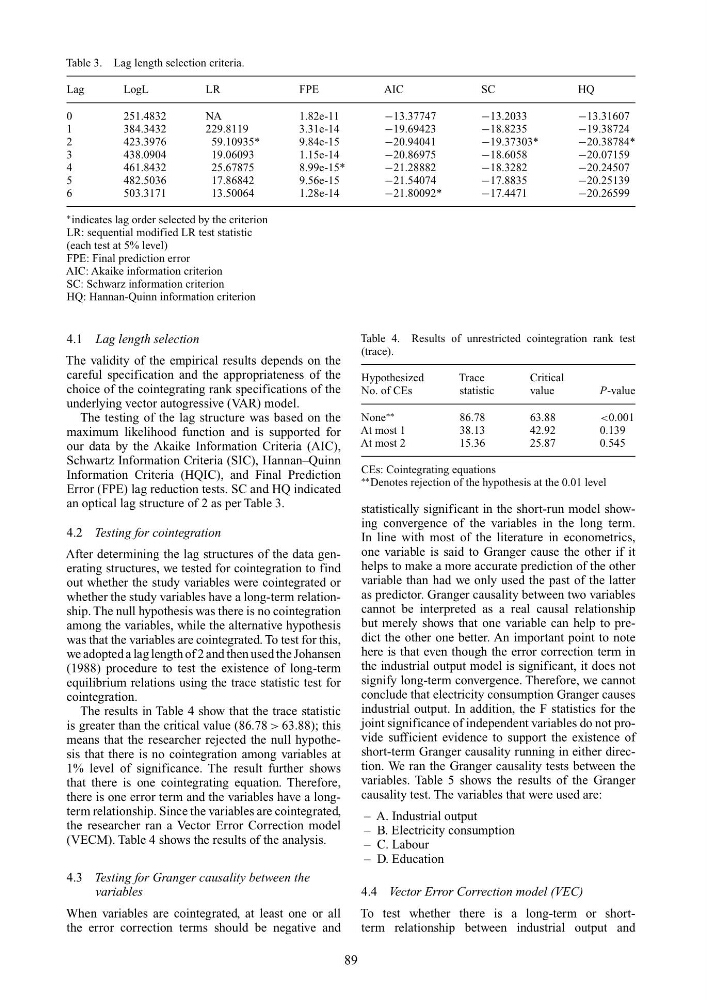
Table 3. Lag length selection criteria.
Lag
LogL
LR
FPE
AIC
SC
HQ
0
251.4832
NA
1.82e-11
−13.37747
−13.2033
−13.31607
1
384.3432
229.8119
3.31e-14
−19.69423
−18.8235
−19.38724
2
423.3976
59.10935*
9.84e-15
−20.94041
−19.37303*
−20.38784*
3
438.0904
19.06093
1.15e-14
−20.86975
−18.6058
−20.07159
4
461.8432
25.67875
8.99e-15*
−21.28882
−18.3282
−20.24507
5
482.5036
17.86842
9.56e-15
−21.54074
−17.8835
−20.25139
6
503.3171
13.50064
1.28e-14
−21.80092*
−17.4471
−20.26599
∗ indicates lag order selected by the criterion
LR: sequential modified LR test statistic
(each test at 5% level)
FPE: Final prediction error
AIC: Akaike information criterion
SC: Schwarz information criterion
HQ: Hannan-Quinn information criterion
4.1 Lag length selection
The validity of the empirical results depends on the
careful specification and the appropriateness of the
choice of the cointegrating rank specifications of the
underlying vector autogressive (VAR) model.
The testing of the lag structure was based on the
maximum likelihood function and is supported for
our data by the Akaike Information Criteria (AIC),
Schwartz Information Criteria (SIC), Hannan–Quinn
Information Criteria (HQIC), and Final Prediction
Error (FPE) lag reduction tests. SC and HQ indicated
an optical lag structure of 2 as per Table 3.
4.2 Testing for cointegration
After determining the lag structures of the data generating structures, we tested for cointegration to find
out whether the study variables were cointegrated or
whether the study variables have a long-term relationship. The null hypothesis was there is no cointegration
among the variables, while the alternative hypothesis
was that the variables are cointegrated. To test for this,
we adopted a lag length of 2 and then used the Johansen
(1988) procedure to test the existence of long-term
equilibrium relations using the trace statistic test for
cointegration.
The results in Table 4 show that the trace statistic
is greater than the critical value (86.78 > 63.88); this
means that the researcher rejected the null hypothesis that there is no cointegration among variables at
1% level of significance. The result further shows
that there is one cointegrating equation. Therefore,
there is one error term and the variables have a longterm relationship. Since the variables are cointegrated,
the researcher ran a Vector Error Correction model
(VECM). Table 4 shows the results of the analysis.
4.3 Testing for Granger causality between the
variables
When variables are cointegrated, at least one or all
the error correction terms should be negative and
Table 4. Results of unrestricted cointegration rank test
(trace).
Hypothesized
Trace
Critical
No. of CEs
statistic
value
P-value
None
∗∗
86.78
63.88
<0.001
At most 1
38.13
42.92
0.139
At most 2
15.36
25.87
0.545
CEs: Cointegrating equations
∗∗ Denotes rejection of the hypothesis at the 0.01 level
statistically significant in the short-run model showing convergence of the variables in the long term.
In line with most of the literature in econometrics,
one variable is said to Granger cause the other if it
helps to make a more accurate prediction of the other
variable than had we only used the past of the latter
as predictor. Granger causality between two variables
cannot be interpreted as a real causal relationship
but merely shows that one variable can help to predict the other one better. An important point to note
here is that even though the error correction term in
the industrial output model is significant, it does not
signify long-term convergence. Therefore, we cannot
conclude that electricity consumption Granger causes
industrial output. In addition, the F statistics for the
joint significance of independent variables do not provide sufficient evidence to support the existence of
short-term Granger causality running in either direction. We ran the Granger causality tests between the
variables. Table 5 shows the results of the Granger
causality test. The variables that were used are:
– A. Industrial output
– B. Electricity consumption
– C. Labour
– D. Education
4.4 Vector Error Correction model (VEC)
To test whether there is a long-term or shortterm relationship between industrial output and
89
Lag
LogL
LR
FPE
AIC
SC
HQ
0
251.4832
NA
1.82e-11
−13.37747
−13.2033
−13.31607
1
384.3432
229.8119
3.31e-14
−19.69423
−18.8235
−19.38724
2
423.3976
59.10935*
9.84e-15
−20.94041
−19.37303*
−20.38784*
3
438.0904
19.06093
1.15e-14
−20.86975
−18.6058
−20.07159
4
461.8432
25.67875
8.99e-15*
−21.28882
−18.3282
−20.24507
5
482.5036
17.86842
9.56e-15
−21.54074
−17.8835
−20.25139
6
503.3171
13.50064
1.28e-14
−21.80092*
−17.4471
−20.26599
∗ indicates lag order selected by the criterion
LR: sequential modified LR test statistic
(each test at 5% level)
FPE: Final prediction error
AIC: Akaike information criterion
SC: Schwarz information criterion
HQ: Hannan-Quinn information criterion
4.1 Lag length selection
The validity of the empirical results depends on the
careful specification and the appropriateness of the
choice of the cointegrating rank specifications of the
underlying vector autogressive (VAR) model.
The testing of the lag structure was based on the
maximum likelihood function and is supported for
our data by the Akaike Information Criteria (AIC),
Schwartz Information Criteria (SIC), Hannan–Quinn
Information Criteria (HQIC), and Final Prediction
Error (FPE) lag reduction tests. SC and HQ indicated
an optical lag structure of 2 as per Table 3.
4.2 Testing for cointegration
After determining the lag structures of the data generating structures, we tested for cointegration to find
out whether the study variables were cointegrated or
whether the study variables have a long-term relationship. The null hypothesis was there is no cointegration
among the variables, while the alternative hypothesis
was that the variables are cointegrated. To test for this,
we adopted a lag length of 2 and then used the Johansen
(1988) procedure to test the existence of long-term
equilibrium relations using the trace statistic test for
cointegration.
The results in Table 4 show that the trace statistic
is greater than the critical value (86.78 > 63.88); this
means that the researcher rejected the null hypothesis that there is no cointegration among variables at
1% level of significance. The result further shows
that there is one cointegrating equation. Therefore,
there is one error term and the variables have a longterm relationship. Since the variables are cointegrated,
the researcher ran a Vector Error Correction model
(VECM). Table 4 shows the results of the analysis.
4.3 Testing for Granger causality between the
variables
When variables are cointegrated, at least one or all
the error correction terms should be negative and
Table 4. Results of unrestricted cointegration rank test
(trace).
Hypothesized
Trace
Critical
No. of CEs
statistic
value
P-value
None
∗∗
86.78
63.88
<0.001
At most 1
38.13
42.92
0.139
At most 2
15.36
25.87
0.545
CEs: Cointegrating equations
∗∗ Denotes rejection of the hypothesis at the 0.01 level
statistically significant in the short-run model showing convergence of the variables in the long term.
In line with most of the literature in econometrics,
one variable is said to Granger cause the other if it
helps to make a more accurate prediction of the other
variable than had we only used the past of the latter
as predictor. Granger causality between two variables
cannot be interpreted as a real causal relationship
but merely shows that one variable can help to predict the other one better. An important point to note
here is that even though the error correction term in
the industrial output model is significant, it does not
signify long-term convergence. Therefore, we cannot
conclude that electricity consumption Granger causes
industrial output. In addition, the F statistics for the
joint significance of independent variables do not provide sufficient evidence to support the existence of
short-term Granger causality running in either direction. We ran the Granger causality tests between the
variables. Table 5 shows the results of the Granger
causality test. The variables that were used are:
– A. Industrial output
– B. Electricity consumption
– C. Labour
– D. Education
4.4 Vector Error Correction model (VEC)
To test whether there is a long-term or shortterm relationship between industrial output and
89