

37
Properties of Pesticides and Contaminants
composition. When boiled, an azeotropic mixture will produce vapor of the
same composition as the liquid mixture, and this situation will not change
with further evaporation. For a hypothetical binary mixture of components,
A and B, total vapor pressure (P t ) can be described as follows:
P = X ˜ P + X ˜ P
(3.15)
t
A A A
B B B
where P A and P B are the saturation vapor pressures of components A and
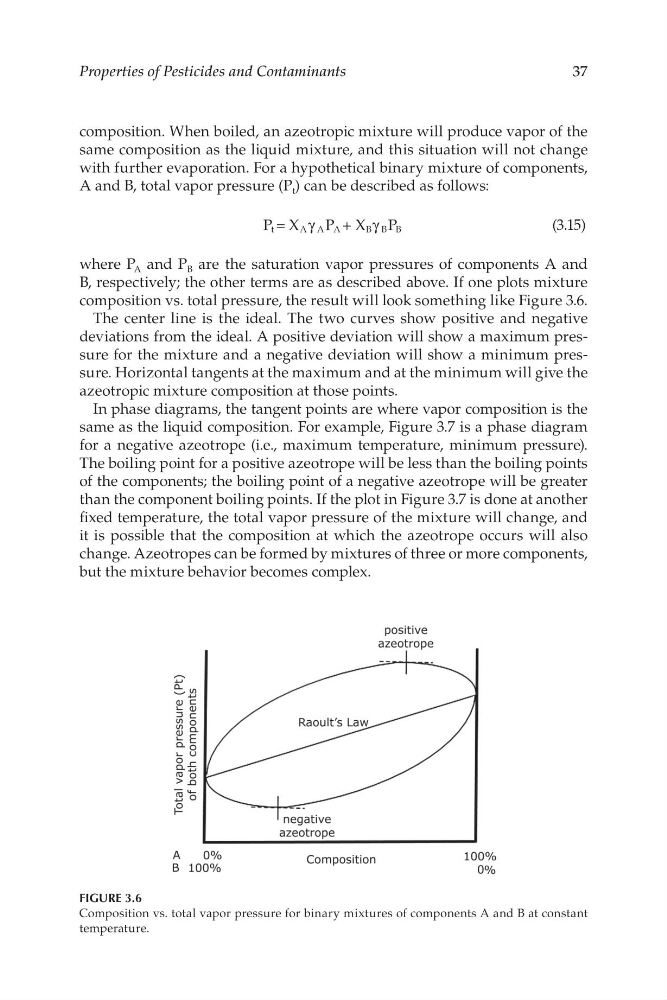
B, respectively; the other terms are as described above. If one plots mixture
composition vs. total pressure, the result will look something like Figure 3.6.
The center line is the ideal. The two curves show positive and negative
deviations from the ideal. A positive deviation will show a maximum pressure for the mixture and a negative deviation will show a minimum pressure. Horizontal tangents at the maximum and at the minimum will give the
azeotropic mixture composition at those points.
In phase diagrams, the tangent points are where vapor composition is the
same as the liquid composition. For example, Figure 3.7 is a phase diagram
for a negative azeotrope (i.e., maximum temperature, minimum pressure).
The boiling point for a positive azeotrope will be less than the boiling points
of the components; the boiling point of a negative azeotrope will be greater
than the component boiling points. If the plot in Figure 3.7 is done at another
fxed temperature, the total vapor pressure of the mixture will change, and
it is possible that the composition at which the azeotrope occurs will also
change. Azeotropes can be formed by mixtures of three or more components,
but the mixture behavior becomes complex.
FIGURE 3.6
Composition vs. total vapor pressure for binary mixtures of components A and B at constant
temperature.
Properties of Pesticides and Contaminants
composition. When boiled, an azeotropic mixture will produce vapor of the
same composition as the liquid mixture, and this situation will not change
with further evaporation. For a hypothetical binary mixture of components,
A and B, total vapor pressure (P t ) can be described as follows:
P = X ˜ P + X ˜ P
(3.15)
t
A A A
B B B
where P A and P B are the saturation vapor pressures of components A and
B, respectively; the other terms are as described above. If one plots mixture
composition vs. total pressure, the result will look something like Figure 3.6.
The center line is the ideal. The two curves show positive and negative
deviations from the ideal. A positive deviation will show a maximum pressure for the mixture and a negative deviation will show a minimum pressure. Horizontal tangents at the maximum and at the minimum will give the
azeotropic mixture composition at those points.
In phase diagrams, the tangent points are where vapor composition is the
same as the liquid composition. For example, Figure 3.7 is a phase diagram
for a negative azeotrope (i.e., maximum temperature, minimum pressure).
The boiling point for a positive azeotrope will be less than the boiling points
of the components; the boiling point of a negative azeotrope will be greater
than the component boiling points. If the plot in Figure 3.7 is done at another
fxed temperature, the total vapor pressure of the mixture will change, and
it is possible that the composition at which the azeotrope occurs will also
change. Azeotropes can be formed by mixtures of three or more components,
but the mixture behavior becomes complex.
FIGURE 3.6
Composition vs. total vapor pressure for binary mixtures of components A and B at constant
temperature.