

28
Pesticides, Organic Contaminants, and Pathogens in Air
TABLE 3.1
Volatilization Rates of Chemical Residues on Noninteractive (Plant, Glass,
Plastic) Surfaces
Ln Flux (µg/m 2 ·hr)
Compound
Surface
Observed
Knudsen b
Beacon oil a
Glass
17.155
17.609
Chevron oil a
Glass
14.845
16.102
Dodecane
Plastic
13.805
15.297
n-Octanol
Glass
14.116
15.107
Tridiphane
Giant foxtail
8.872
9.159
Trifuralin
Weedy turf
7.371
8.487
Pendimethalin
Turfgrass
6.947
7.098
2,4-D (isooctyl)
Wheat
6.507
6.799
Diazinon
Dormant orchard
6.812
6.155
Toxaphene
Cotton
5.293
5.278
Dieldrin
Weedy turf
5.147
5.447
p,p′-DDT
Cotton
3.824
2.708
Source: Reprinted (adapted) with permission from Woodrow, J.E., Seiber, J.N., and
Baker, L.W. (1997). Correlation Techniques for Estimating Pesticide
Volatilization Flux and Downwind Concentrations. Environ. Sci. Technol.
21(2), 523–529. Copyright (1997) American Chemical Society.
a Herbicidal mixtures of light hydrocarbons.
b Molecular effusion from pure material.
where Q is fux (g/cm 2 /sec), P is the vapor pressure (dyn/cm 2 ) at T, M is the
molecular weight, R is the gas constant (8.314 × 10 7 erg/K·mol), and T is temperature. This equation describes molecular effusion from pure material and
includes only intermolecular interactions in the material, as refected in the
vapor pressure. In an earlier study, the Knudsen equation was used to estimate fux for a series of chemicals applied to foliage and other noninteractive
surfaces (Woodrow et al., 1997). The calculated values were compared to fux
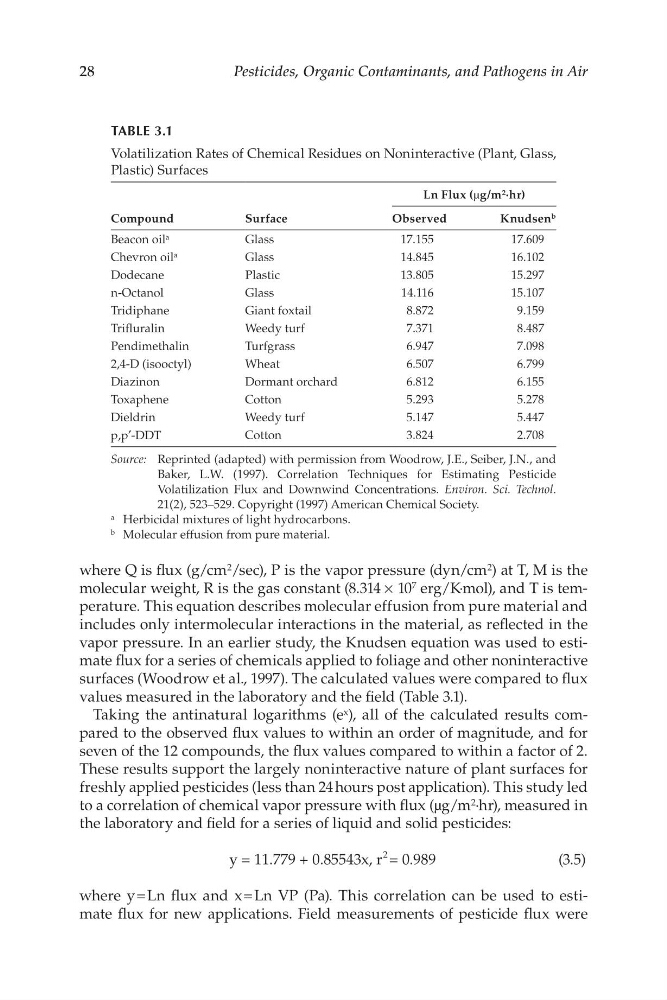
values measured in the laboratory and the feld (Table 3.1).
Taking the antinatural logarithms (e x ), all of the calculated results compared to the observed fux values to within an order of magnitude, and for
seven of the 12 compounds, the fux values compared to within a factor of 2.
These results support the largely noninteractive nature of plant surfaces for
freshly applied pesticides (less than 24 hours post application). This study led
to a correlation of chemical vapor pressure with fux (µg/m 2 ·hr), measured in
the laboratory and feld for a series of liquid and solid pesticides:
y = 11.779 + 0.85543x, r
2 = 0.989
(3.5)
where y = Ln fux and x = Ln VP (Pa). This correlation can be used to estimate fux for new applications. Field measurements of pesticide fux were
Pesticides, Organic Contaminants, and Pathogens in Air
TABLE 3.1
Volatilization Rates of Chemical Residues on Noninteractive (Plant, Glass,
Plastic) Surfaces
Ln Flux (µg/m 2 ·hr)
Compound
Surface
Observed
Knudsen b
Beacon oil a
Glass
17.155
17.609
Chevron oil a
Glass
14.845
16.102
Dodecane
Plastic
13.805
15.297
n-Octanol
Glass
14.116
15.107
Tridiphane
Giant foxtail
8.872
9.159
Trifuralin
Weedy turf
7.371
8.487
Pendimethalin
Turfgrass
6.947
7.098
2,4-D (isooctyl)
Wheat
6.507
6.799
Diazinon
Dormant orchard
6.812
6.155
Toxaphene
Cotton
5.293
5.278
Dieldrin
Weedy turf
5.147
5.447
p,p′-DDT
Cotton
3.824
2.708
Source: Reprinted (adapted) with permission from Woodrow, J.E., Seiber, J.N., and
Baker, L.W. (1997). Correlation Techniques for Estimating Pesticide
Volatilization Flux and Downwind Concentrations. Environ. Sci. Technol.
21(2), 523–529. Copyright (1997) American Chemical Society.
a Herbicidal mixtures of light hydrocarbons.
b Molecular effusion from pure material.
where Q is fux (g/cm 2 /sec), P is the vapor pressure (dyn/cm 2 ) at T, M is the
molecular weight, R is the gas constant (8.314 × 10 7 erg/K·mol), and T is temperature. This equation describes molecular effusion from pure material and
includes only intermolecular interactions in the material, as refected in the
vapor pressure. In an earlier study, the Knudsen equation was used to estimate fux for a series of chemicals applied to foliage and other noninteractive
surfaces (Woodrow et al., 1997). The calculated values were compared to fux
values measured in the laboratory and the feld (Table 3.1).
Taking the antinatural logarithms (e x ), all of the calculated results compared to the observed fux values to within an order of magnitude, and for
seven of the 12 compounds, the fux values compared to within a factor of 2.
These results support the largely noninteractive nature of plant surfaces for
freshly applied pesticides (less than 24 hours post application). This study led
to a correlation of chemical vapor pressure with fux (µg/m 2 ·hr), measured in
the laboratory and feld for a series of liquid and solid pesticides:
y = 11.779 + 0.85543x, r
2 = 0.989
(3.5)
where y = Ln fux and x = Ln VP (Pa). This correlation can be used to estimate fux for new applications. Field measurements of pesticide fux were