

168
Pesticides, Organic Contaminants, and Pathogens in Air
compared to other surface waters excluding waters near point sources of
TFA. It also clearly showed the year-to-year carryover of TFA as predicted.
Furthermore, the TFA was being taken up into plants and concentrating even
more in the plant tissues (Cahill et al., 2001). Once again, this study was conducted fairly early in the HFC adoption and atmospheric formation of TFA is
expected to be higher now. With the carryover of TFA between seasons and
the increased deposition of TFA, the concentrations are likely higher now
and warrant additional research.
9.5.5 Point Sources of TFA
The last main set of reported environmental TFA data are concentrations near
point sources such as fuorochemical manufacturing facilities, landflls, and
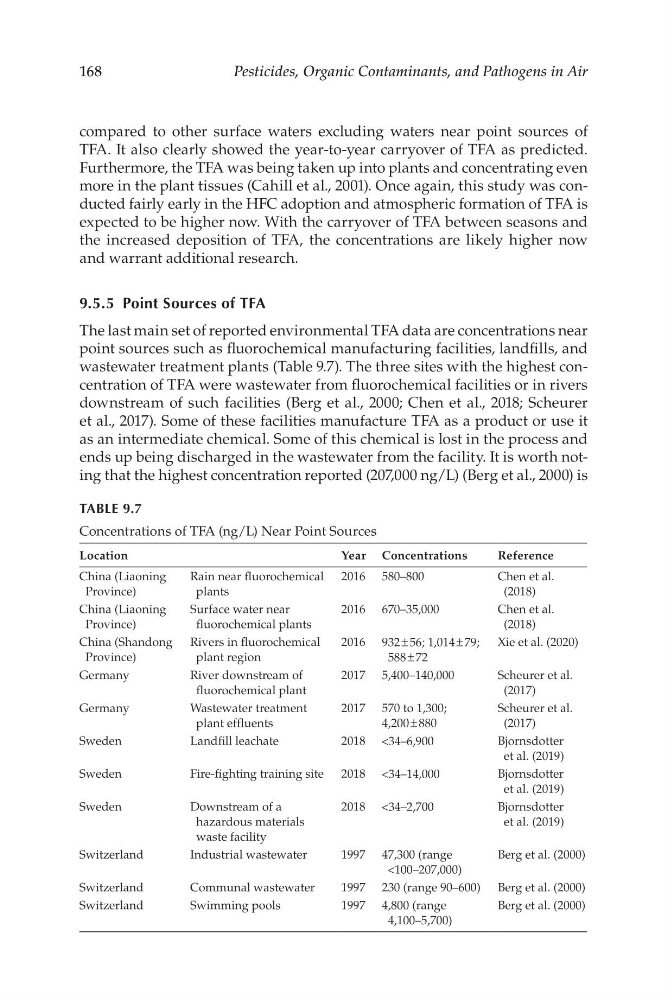
wastewater treatment plants (Table 9.7). The three sites with the highest concentration of TFA were wastewater from fuorochemical facilities or in rivers
downstream of such facilities (Berg et al., 2000; Chen et al., 2018; Scheurer
et al., 2017). Some of these facilities manufacture TFA as a product or use it
as an intermediate chemical. Some of this chemical is lost in the process and
ends up being discharged in the wastewater from the facility. It is worth noting that the highest concentration reported (207,000 ng/L) (Berg et al., 2000) is
TABLE 9.7
Concentrations of TFA (ng/L) Near Point Sources
Location
Year Concentrations
Reference
China (Liaoning
Rain near fuorochemical 2016 580–800
Chen et al.
Province)
plants
(2018)
China (Liaoning
Surface water near
2016 670–35,000
Chen et al.
Province)
fuorochemical plants
(2018)
China (Shandong Rivers in fuorochemical
2016 932 ± 56; 1,014 ± 79;
Xie et al. (2020)
Province)
plant region
588 ± 72
Germany
River downstream of
2017 5,400–140,000
Scheurer et al.
fuorochemical plant
(2017)
Germany
Wastewater treatment
2017 570 to 1,300;
Scheurer et al.
plant effuents
4,200 ± 880
(2017)
Sweden
Landfll leachate
2018 <34–6,900
Bjornsdotter
et al. (2019)
Sweden
Fire-fghting training site 2018 <34–14,000
Bjornsdotter
et al. (2019)
Sweden
Downstream of a
2018 <34–2,700
Bjornsdotter
hazardous materials
et al. (2019)
waste facility
Switzerland
Industrial wastewater
1997 47,300 (range
Berg et al. (2000)
<100–207,000)
Switzerland
Communal wastewater
1997 230 (range 90–600) Berg et al. (2000)
Switzerland
Swimming pools
1997 4,800 (range
Berg et al. (2000)
4,100–5,700)
Pesticides, Organic Contaminants, and Pathogens in Air
compared to other surface waters excluding waters near point sources of
TFA. It also clearly showed the year-to-year carryover of TFA as predicted.
Furthermore, the TFA was being taken up into plants and concentrating even
more in the plant tissues (Cahill et al., 2001). Once again, this study was conducted fairly early in the HFC adoption and atmospheric formation of TFA is
expected to be higher now. With the carryover of TFA between seasons and
the increased deposition of TFA, the concentrations are likely higher now
and warrant additional research.
9.5.5 Point Sources of TFA
The last main set of reported environmental TFA data are concentrations near
point sources such as fuorochemical manufacturing facilities, landflls, and
wastewater treatment plants (Table 9.7). The three sites with the highest concentration of TFA were wastewater from fuorochemical facilities or in rivers
downstream of such facilities (Berg et al., 2000; Chen et al., 2018; Scheurer
et al., 2017). Some of these facilities manufacture TFA as a product or use it
as an intermediate chemical. Some of this chemical is lost in the process and
ends up being discharged in the wastewater from the facility. It is worth noting that the highest concentration reported (207,000 ng/L) (Berg et al., 2000) is
TABLE 9.7
Concentrations of TFA (ng/L) Near Point Sources
Location
Year Concentrations
Reference
China (Liaoning
Rain near fuorochemical 2016 580–800
Chen et al.
Province)
plants
(2018)
China (Liaoning
Surface water near
2016 670–35,000
Chen et al.
Province)
fuorochemical plants
(2018)
China (Shandong Rivers in fuorochemical
2016 932 ± 56; 1,014 ± 79;
Xie et al. (2020)
Province)
plant region
588 ± 72
Germany
River downstream of
2017 5,400–140,000
Scheurer et al.
fuorochemical plant
(2017)
Germany
Wastewater treatment
2017 570 to 1,300;
Scheurer et al.
plant effuents
4,200 ± 880
(2017)
Sweden
Landfll leachate
2018 <34–6,900
Bjornsdotter
et al. (2019)
Sweden
Fire-fghting training site 2018 <34–14,000
Bjornsdotter
et al. (2019)
Sweden
Downstream of a
2018 <34–2,700
Bjornsdotter
hazardous materials
et al. (2019)
waste facility
Switzerland
Industrial wastewater
1997 47,300 (range
Berg et al. (2000)
<100–207,000)
Switzerland
Communal wastewater
1997 230 (range 90–600) Berg et al. (2000)
Switzerland
Swimming pools
1997 4,800 (range
Berg et al. (2000)
4,100–5,700)