

c
Fumigants
133
TABLE 8.3
A Summary of Measured Ambient Air Concentrations (μg/m 3 ) of MeBr in Salinas
Valley, CA, on September 1–4, 1995, at all locations
Day
MB
SN
SS
AS
KC
FP
CC
KF
MR
MT
BF
9/1
ND a 0.654 FE b 0.974
0.54
1.23
2.12 0.777
FE
0.041
0.658
9/2
ND
0.3
0.751 0.656
ND
ND
0.156
ND
9/3
1.37
1.85 0.881 0.599 0.445
1.05
3.16
1.94 0.765
0.064
0.819
9/4
FE
0.717 0.807 0.651 0.319
0.652 1.13
0.98 0.604
0.148
0.623
Avg
–
0.881 0.813 0.72
0.435
1.04
2.49
1.23 0.684
0.102
0.7
Night
9/1
ND
FE
2.22 0.294
0.17
0.231 0.873 1.09 0.708
1.05
8.37
3.43
2.15
0.316
ND
2.01
ND
ND
0.407
ND
9/3
0.25
3.36
8.98
1.16
0.551
1.13 0.773
1.7
2.14
0.117
2.16
Avg
0.65
5.86
4.88
1.2
0.346
0.68
1.22
1.4
1.42
0.202
1.17
Source: Reprinted from Honaganahalli, P.S., and Seiber, J.N. (2000). Measured and predicted
airshed concentrations of methyl bromide in an agricultural valley and applications
to exposure assessment. Atmos. Environ. 34, 3511–3523. Copyright (2000), with permission from Elsevier.
a LOD, Limit of detection = 48 ng/m 3 .
b ND, No determination.
FE, Field error sample lost.
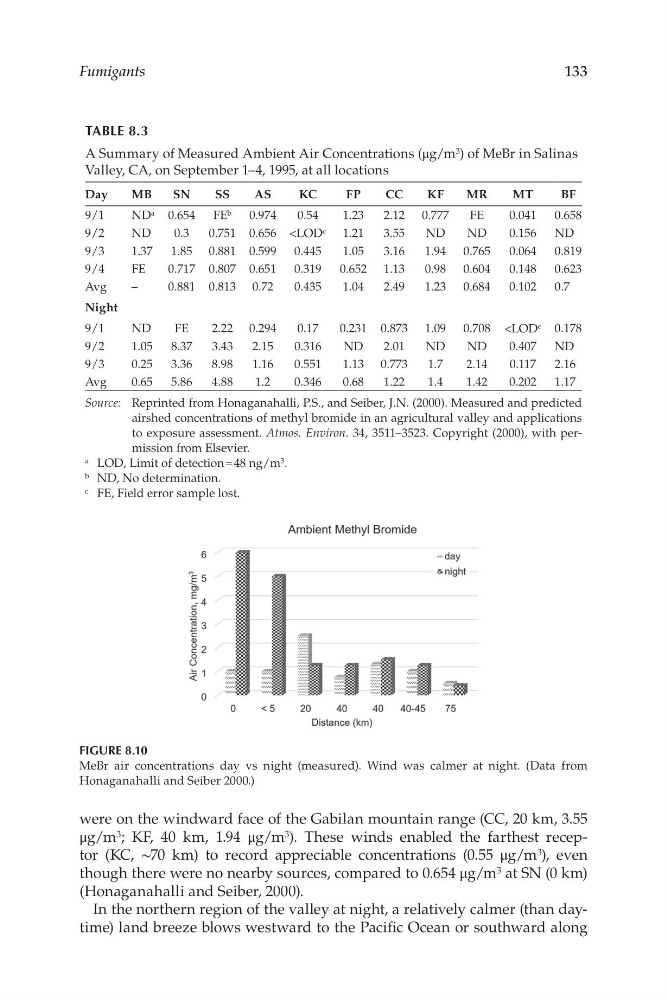
FIGURE 8.10
MeBr air concentrations day vs night (measured). Wind was calmer at night. (Data from
Honaganahalli and Seiber 2000.)
were on the windward face of the Gabilan mountain range (CC, 20 km, 3.55
μg/m 3 ; KF, 40 km, 1.94 μg/m 3 ). These winds enabled the farthest receptor (KC, ∼70 km) to record appreciable concentrations (0.55 μg/m 3 ), even
though there were no nearby sources, compared to 0.654 μg/m 3 at SN (0 km)
(Honaganahalli and Seiber, 2000).
In the northern region of the valley at night, a relatively calmer (than daytime) land breeze blows westward to the Pacifc Ocean or southward along
Fumigants
133
TABLE 8.3
A Summary of Measured Ambient Air Concentrations (μg/m 3 ) of MeBr in Salinas
Valley, CA, on September 1–4, 1995, at all locations
Day
MB
SN
SS
AS
KC
FP
CC
KF
MR
MT
BF
9/1
ND a 0.654 FE b 0.974
0.54
1.23
2.12 0.777
FE
0.041
0.658
9/2
ND
0.3
0.751 0.656
ND
ND
0.156
ND
9/3
1.37
1.85 0.881 0.599 0.445
1.05
3.16
1.94 0.765
0.064
0.819
9/4
FE
0.717 0.807 0.651 0.319
0.652 1.13
0.98 0.604
0.148
0.623
Avg
–
0.881 0.813 0.72
0.435
1.04
2.49
1.23 0.684
0.102
0.7
Night
9/1
ND
FE
2.22 0.294
0.17
0.231 0.873 1.09 0.708
1.05
8.37
3.43
2.15
0.316
ND
2.01
ND
ND
0.407
ND
9/3
0.25
3.36
8.98
1.16
0.551
1.13 0.773
1.7
2.14
0.117
2.16
Avg
0.65
5.86
4.88
1.2
0.346
0.68
1.22
1.4
1.42
0.202
1.17
Source: Reprinted from Honaganahalli, P.S., and Seiber, J.N. (2000). Measured and predicted
airshed concentrations of methyl bromide in an agricultural valley and applications
to exposure assessment. Atmos. Environ. 34, 3511–3523. Copyright (2000), with permission from Elsevier.
a LOD, Limit of detection = 48 ng/m 3 .
b ND, No determination.
FE, Field error sample lost.
FIGURE 8.10
MeBr air concentrations day vs night (measured). Wind was calmer at night. (Data from
Honaganahalli and Seiber 2000.)
were on the windward face of the Gabilan mountain range (CC, 20 km, 3.55
μg/m 3 ; KF, 40 km, 1.94 μg/m 3 ). These winds enabled the farthest receptor (KC, ∼70 km) to record appreciable concentrations (0.55 μg/m 3 ), even
though there were no nearby sources, compared to 0.654 μg/m 3 at SN (0 km)
(Honaganahalli and Seiber, 2000).
In the northern region of the valley at night, a relatively calmer (than daytime) land breeze blows westward to the Pacifc Ocean or southward along