

132
Pesticides, Organic Contaminants, and Pathogens in Air
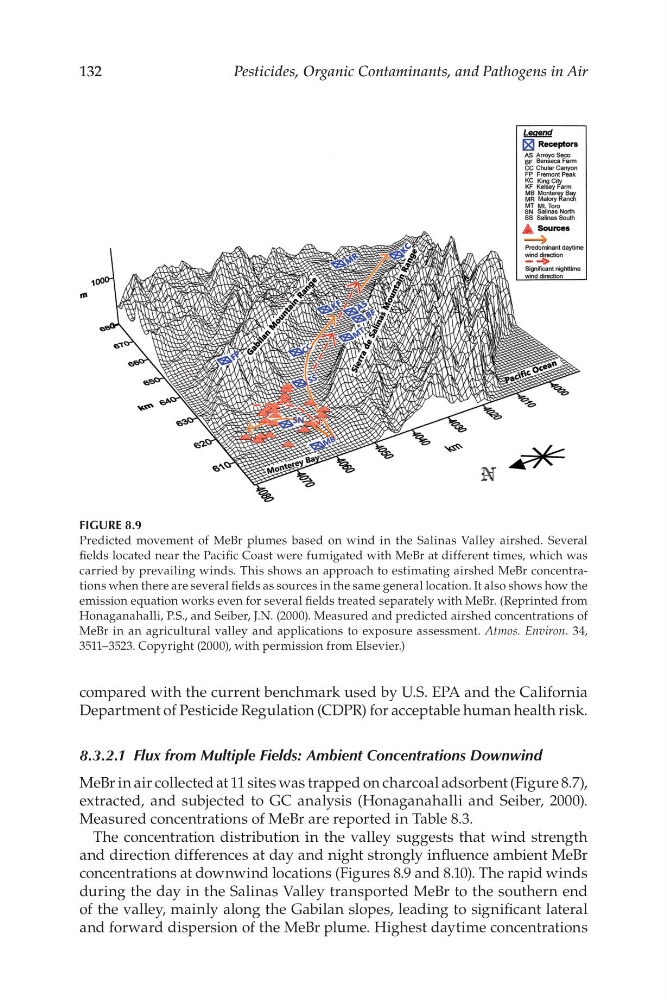
FIGURE 8.9
Predicted movement of MeBr plumes based on wind in the Salinas Valley airshed. Several
felds located near the Pacifc Coast were fumigated with MeBr at different times, which was
carried by prevailing winds. This shows an approach to estimating airshed MeBr concentrations when there are several felds as sources in the same general location. It also shows how the
emission equation works even for several felds treated separately with MeBr. (Reprinted from
Honaganahalli, P.S., and Seiber, J.N. (2000). Measured and predicted airshed concentrations of
MeBr in an agricultural valley and applications to exposure assessment. Atmos. Environ. 34,
3511–3523. Copyright (2000), with permission from Elsevier.)
compared with the current benchmark used by U.S. EPA and the California
Department of Pesticide Regulation (CDPR) for acceptable human health risk.
8.3.2.1 Flux from Multiple Fields: Ambient Concentrations Downwind
MeBr in air collected at 11 sites was trapped on charcoal adsorbent (Figure 8.7),
extracted, and subjected to GC analysis (Honaganahalli and Seiber, 2000).
Measured concentrations of MeBr are reported in Table 8.3.
The concentration distribution in the valley suggests that wind strength
and direction differences at day and night strongly infuence ambient MeBr
concentrations at downwind locations (Figures 8.9 and 8.10). The rapid winds
during the day in the Salinas Valley transported MeBr to the southern end
of the valley, mainly along the Gabilan slopes, leading to signifcant lateral
and forward dispersion of the MeBr plume. Highest daytime concentrations
Pesticides, Organic Contaminants, and Pathogens in Air
FIGURE 8.9
Predicted movement of MeBr plumes based on wind in the Salinas Valley airshed. Several
felds located near the Pacifc Coast were fumigated with MeBr at different times, which was
carried by prevailing winds. This shows an approach to estimating airshed MeBr concentrations when there are several felds as sources in the same general location. It also shows how the
emission equation works even for several felds treated separately with MeBr. (Reprinted from
Honaganahalli, P.S., and Seiber, J.N. (2000). Measured and predicted airshed concentrations of
MeBr in an agricultural valley and applications to exposure assessment. Atmos. Environ. 34,
3511–3523. Copyright (2000), with permission from Elsevier.)
compared with the current benchmark used by U.S. EPA and the California
Department of Pesticide Regulation (CDPR) for acceptable human health risk.
8.3.2.1 Flux from Multiple Fields: Ambient Concentrations Downwind
MeBr in air collected at 11 sites was trapped on charcoal adsorbent (Figure 8.7),
extracted, and subjected to GC analysis (Honaganahalli and Seiber, 2000).
Measured concentrations of MeBr are reported in Table 8.3.
The concentration distribution in the valley suggests that wind strength
and direction differences at day and night strongly infuence ambient MeBr
concentrations at downwind locations (Figures 8.9 and 8.10). The rapid winds
during the day in the Salinas Valley transported MeBr to the southern end
of the valley, mainly along the Gabilan slopes, leading to signifcant lateral
and forward dispersion of the MeBr plume. Highest daytime concentrations