

109
Pesticides in Fog
TABLE 7.1 (Continued)
Distribution of Pesticides and Their Alteration Products between Fogwater and
Interstitial Air in California
Chemical
Distribution Ratio
Concentration
(×10 6 ) Air–Water
Fogwater
Air
Measured Literature Enrichment
Chemical
Location
(ng/L)
(ng/m 3 )
(D)
(H)
Factor (EF)
Malathion
P
70
<0.03
<0.4
2.4
>6
L
110
0.02
0.18
13
C
350
Oxygen Analogs (OAs)
Parathion OA
P
9,000
0.21
0.02
0.25
11
C
950
0.66
0.07
3.6
L
184,000
0.25
0.00
250
Methidathion OA P
120
0.03
<0.25
–
–
L
8,200
Chlorpyrifos OA
P
170
<0.03
<0.18
–
–
L
800
Diazinon OA
P
190
<0.03
<0.16
–
–
Cotton Defoliant
DEF
P
250
<0.03
<0.7
0.2
–
C
800
0.14
<0.4
Herbicides
Atrazine
P
270
<0.2
<0.7
0.2
–
C
320
<0.16
<0.4
–
L
700
–
–
–
Simazine
P
390
<0.1
<0.3
0.025
–
C
110
<0.06
<0.5
–
L
1,200
–
–
–
Pendimethalin
P
1,370
0.64
0.47
1,500
3,200
C
3,620
3.6
1.0
1,500
Source: Glotfelty, D.E., Seiber, J.N., and Liljedahl, A. (1987). Pesticides in fog. Nature 325,
602–605.
Note: Samples were collected in 1985 and parathion was banned by EPA in about 1980.
C, Corcoran, CA on January 13, 1985; EF, ratio of literature to measured distribution ratio, refects
aqueous-phase enrichment; L, Lodi, CA on January 19, 1985, P, Parlier, CA on January 13, 1985.
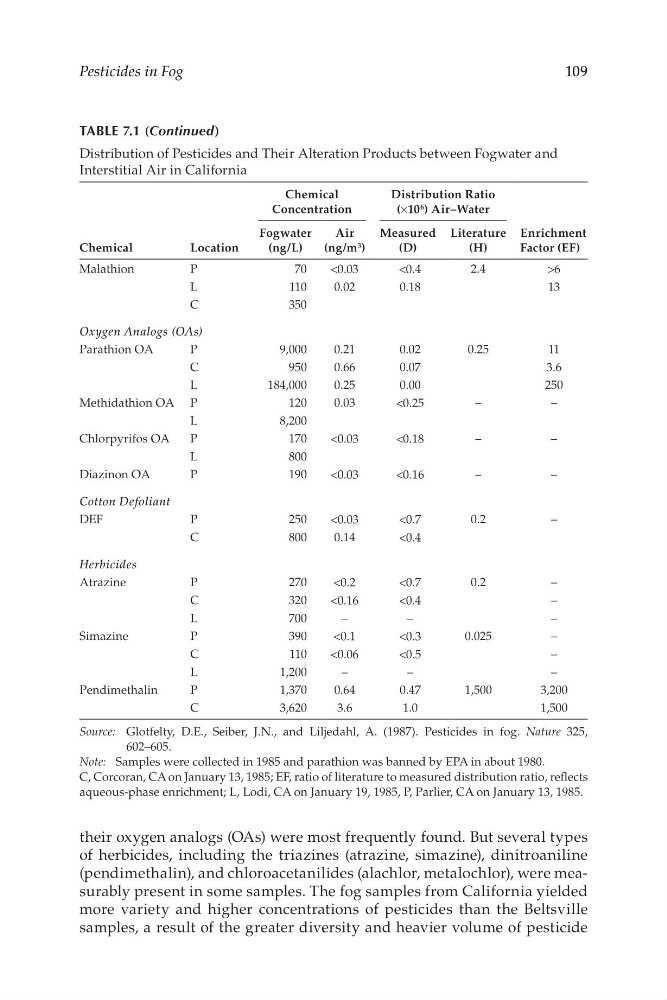
their oxygen analogs (OAs) were most frequently found. But several types
of herbicides, including the triazines (atrazine, simazine), dinitroaniline
(pendimethalin), and chloroacetanilides (alachlor, metalochlor), were measurably present in some samples. The fog samples from California yielded
more variety and higher concentrations of pesticides than the Beltsville
samples, a result of the greater diversity and heavier volume of pesticide
Pesticides in Fog
TABLE 7.1 (Continued)
Distribution of Pesticides and Their Alteration Products between Fogwater and
Interstitial Air in California
Chemical
Distribution Ratio
Concentration
(×10 6 ) Air–Water
Fogwater
Air
Measured Literature Enrichment
Chemical
Location
(ng/L)
(ng/m 3 )
(D)
(H)
Factor (EF)
Malathion
P
70
<0.03
<0.4
2.4
>6
L
110
0.02
0.18
13
C
350
Oxygen Analogs (OAs)
Parathion OA
P
9,000
0.21
0.02
0.25
11
C
950
0.66
0.07
3.6
L
184,000
0.25
0.00
250
Methidathion OA P
120
0.03
<0.25
–
–
L
8,200
Chlorpyrifos OA
P
170
<0.03
<0.18
–
–
L
800
Diazinon OA
P
190
<0.03
<0.16
–
–
Cotton Defoliant
DEF
P
250
<0.03
<0.7
0.2
–
C
800
0.14
<0.4
Herbicides
Atrazine
P
270
<0.2
<0.7
0.2
–
C
320
<0.16
<0.4
–
L
700
–
–
–
Simazine
P
390
<0.1
<0.3
0.025
–
C
110
<0.06
<0.5
–
L
1,200
–
–
–
Pendimethalin
P
1,370
0.64
0.47
1,500
3,200
C
3,620
3.6
1.0
1,500
Source: Glotfelty, D.E., Seiber, J.N., and Liljedahl, A. (1987). Pesticides in fog. Nature 325,
602–605.
Note: Samples were collected in 1985 and parathion was banned by EPA in about 1980.
C, Corcoran, CA on January 13, 1985; EF, ratio of literature to measured distribution ratio, refects
aqueous-phase enrichment; L, Lodi, CA on January 19, 1985, P, Parlier, CA on January 13, 1985.
their oxygen analogs (OAs) were most frequently found. But several types
of herbicides, including the triazines (atrazine, simazine), dinitroaniline
(pendimethalin), and chloroacetanilides (alachlor, metalochlor), were measurably present in some samples. The fog samples from California yielded
more variety and higher concentrations of pesticides than the Beltsville
samples, a result of the greater diversity and heavier volume of pesticide