

172
Subtle Agroecologies
R40yellow/blue is relative and is not a simple value for maturation, such as of the amount of secondary metabolites. It has to be interpreted depending on the sample: the sample type, the plant’s
organs such as e.g. seed, fruit, leaf have to be considered, and the evaluation scale has to be obtained
from the object itself. As the maturation stages of fruits are the plant’s steps on its way to its characteristic well-formed, well-shaped, evolved fnal stage of development before it decays in several
stages to death, it can be seen that the different organs differ with progressing maturation, and
the FES results represent this. Strube and Stolz (2002) concluded that this development can be
interpreted as an increased differentiating, organisational capacity or performance (in German:
Organisationsleistung, cf. also Egerer, 2009) and that it was present in the apples grown under full
light or in those with biodynamic preparations (Figure 15.5; Strube and Stolz, 2002). In other situations, such as where the crop is intensively fertilised or grown in in vitro cultivation, growth showed
less differentiation.
3) EMISSION SPECTRUMS AS DEPENDENT ON THE TYPE OF SAMPLE AND THE SAMPLE STATE
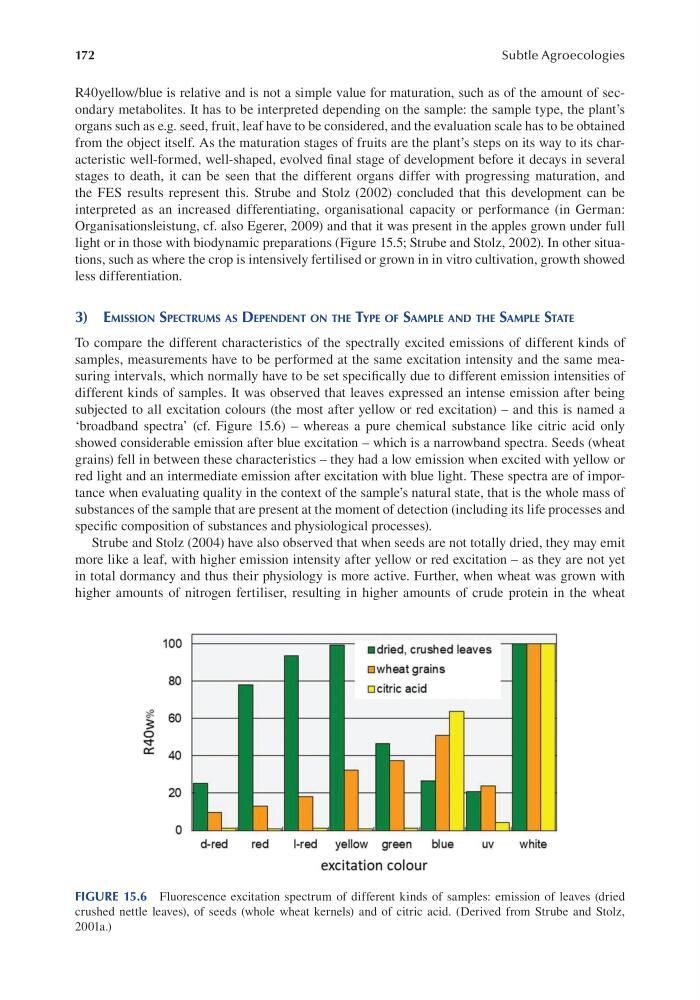
To compare the different characteristics of the spectrally excited emissions of different kinds of
samples, measurements have to be performed at the same excitation intensity and the same measuring intervals, which normally have to be set specifcally due to different emission intensities of
different kinds of samples. It was observed that leaves expressed an intense emission after being
subjected to all excitation colours (the most after yellow or red excitation) – and this is named a
‘broadband spectra’ (cf. Figure 15.6) – whereas a pure chemical substance like citric acid only
showed considerable emission after blue excitation – which is a narrowband spectra. Seeds (wheat
grains) fell in between these characteristics – they had a low emission when excited with yellow or
red light and an intermediate emission after excitation with blue light. These spectra are of importance when evaluating quality in the context of the sample’s natural state, that is the whole mass of
substances of the sample that are present at the moment of detection (including its life processes and
specifc composition of substances and physiological processes).
Strube and Stolz (2004) have also observed that when seeds are not totally dried, they may emit
more like a leaf, with higher emission intensity after yellow or red excitation – as they are not yet
in total dormancy and thus their physiology is more active. Further, when wheat was grown with
higher amounts of nitrogen fertiliser, resulting in higher amounts of crude protein in the wheat
FIGURE 15.6 Fluorescence excitation spectrum of different kinds of samples: emission of leaves (dried
crushed nettle leaves), of seeds (whole wheat kernels) and of citric acid. (Derived from Strube and Stolz,
2001a.)