

169
FES to Evaluate Food Quality
source of light
(excitation)
photomultiplier
(emission detection)
sample
PC
(data
storage)
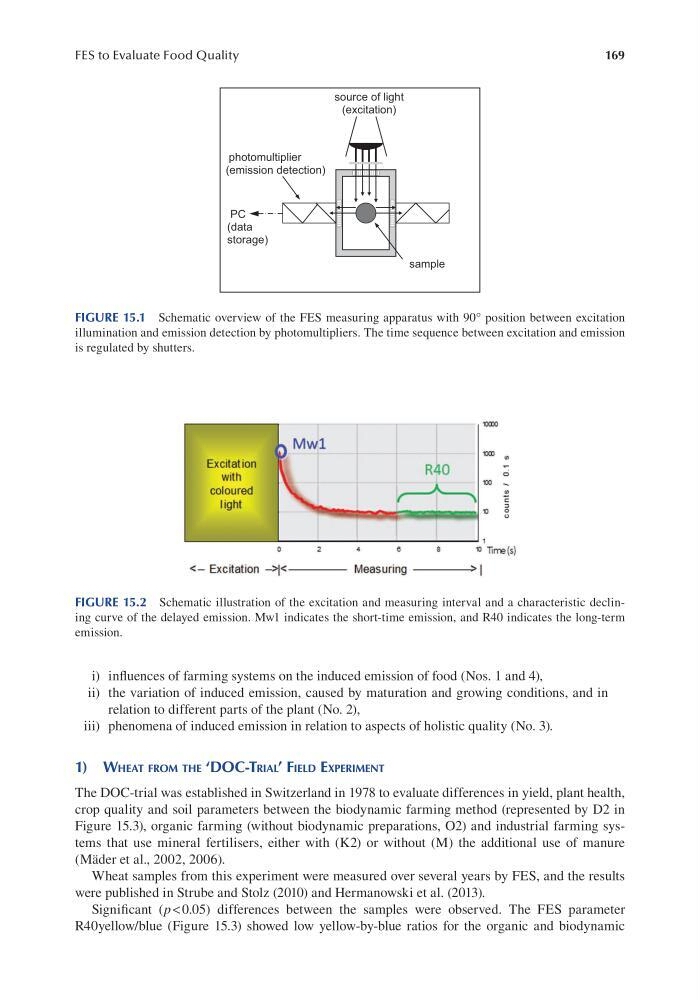
FIGURE 15.1 Schematic overview of the FES measuring apparatus with 90° position between excitation
illumination and emission detection by photomultipliers. The time sequence between excitation and emission
is regulated by shutters.
FIGURE 15.2 Schematic illustration of the excitation and measuring interval and a characteristic declining curve of the delayed emission. Mw1 indicates the short-time emission, and R40 indicates the long-term
emission.
i) infuences of farming systems on the induced emission of food (Nos. 1 and 4),
ii) the variation of induced emission, caused by maturation and growing conditions, and in
relation to different parts of the plant (No. 2),
iii) phenomena of induced emission in relation to aspects of holistic quality (No. 3).
1) WHEAT FROM THE ‘DOC-TRIAL’ FIELD EXPERIMENT
The DOC-trial was established in Switzerland in 1978 to evaluate differences in yield, plant health,
crop quality and soil parameters between the biodynamic farming method (represented by D2 in
Figure 15.3), organic farming (without biodynamic preparations, O2) and industrial farming systems that use mineral fertilisers, either with (K2) or without (M) the additional use of manure
(Mäder et al., 2002, 2006).
Wheat samples from this experiment were measured over several years by FES, and the results
were published in Strube and Stolz (2010) and Hermanowski et al. (2013).
Signifcant (p < 0.05) differences between the samples were observed. The FES parameter
R40yellow/blue (Figure 15.3) showed low yellow-by-blue ratios for the organic and biodynamic