

128
Subtle Agroecologies
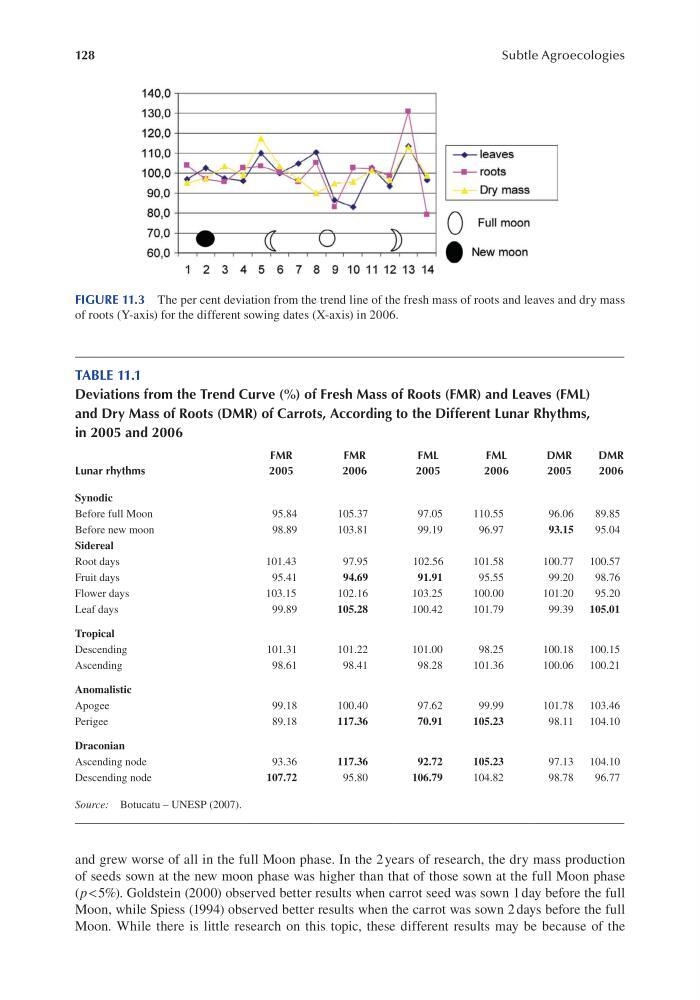
FIGURE 11.3 The per cent deviation from the trend line of the fresh mass of roots and leaves and dry mass
of roots (Y-axis) for the different sowing dates (X-axis) in 2006.
TABLE 11.1
Deviations from the Trend Curve (%) of Fresh Mass of Roots (FMR) and Leaves (FML)
and Dry Mass of Roots (DMR) of Carrots, According to the Different Lunar Rhythms,
in 2005 and 2006
FMR
FMR
FML
FML
DMR
DMR
Lunar rhythms
2005
2006
2005
2006
2005
2006
Synodic
Before full Moon
95.84
105.37
97.05
110.55
96.06
89.85
Before new moon
98.89
103.81
99.19
96.97
93.15
95.04
Sidereal
Root days
101.43
97.95
102.56
101.58
100.77 100.57
Fruit days
95.41
94.69
91.91
95.55
99.20
98.76
Flower days
103.15
102.16
103.25
100.00
101.20
95.20
Leaf days
99.89
105.28
100.42
101.79
99.39 105.01
Tropical
Descending
101.31
101.22
101.00
98.25
100.18 100.15
Ascending
98.61
98.41
98.28
101.36
100.06 100.21
Anomalistic
Apogee
99.18
100.40
97.62
99.99
101.78 103.46
Perigee
89.18
117.36
70.91
105.23
98.11 104.10
Draconian
Ascending node
93.36
117.36
92.72
105.23
97.13 104.10
Descending node
107.72
95.80
106.79
104.82
98.78
96.77
Source: Botucatu – UNESP (2007).
and grew worse of all in the full Moon phase. In the 2 years of research, the dry mass production
of seeds sown at the new moon phase was higher than that of those sown at the full Moon phase
(p < 5%). Goldstein (2000) observed better results when carrot seed was sown 1 day before the full
Moon, while Spiess (1994) observed better results when the carrot was sown 2 days before the full
Moon. While there is little research on this topic, these different results may be because of the