

127
y = -0,0046x
2 + 0,0802x + 3,969
R
2 = 0,856
y = -0,0009x
2 + 0,0238x + 2,0684
R
2 = 0,0956
Astronomical Rhythms in Agriculture
every day for 31 days, and in 2006, carrot was sown every other day during the same period as for
2005. The experiment was performed with 4 randomised blocks and 31 treatments (different dates)
in 2005 and 14 treatments in 2006. The harvest was undertaken 82 days after the sowing, when
carrot roots hold the most desirable qualities for organic and biodynamic consumers. The data for
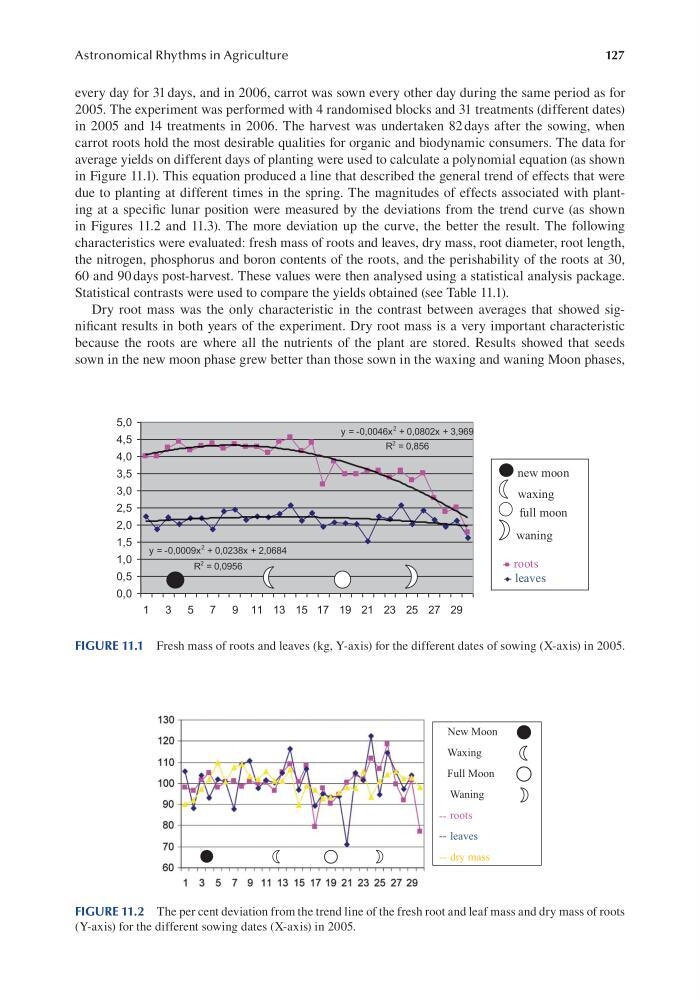
average yields on different days of planting were used to calculate a polynomial equation (as shown
in Figure 11.1). This equation produced a line that described the general trend of effects that were
due to planting at different times in the spring. The magnitudes of effects associated with planting at a specifc lunar position were measured by the deviations from the trend curve (as shown
in Figures 11.2 and 11.3). The more deviation up the curve, the better the result. The following
characteristics were evaluated: fresh mass of roots and leaves, dry mass, root diameter, root length,
the nitrogen, phosphorus and boron contents of the roots, and the perishability of the roots at 30,
60 and 90 days post-harvest. These values were then analysed using a statistical analysis package.
Statistical contrasts were used to compare the yields obtained (see Table 11.1).
Dry root mass was the only characteristic in the contrast between averages that showed signifcant results in both years of the experiment. Dry root mass is a very important characteristic
because the roots are where all the nutrients of the plant are stored. Results showed that seeds
sown in the new moon phase grew better than those sown in the waxing and waning Moon phases,
5,0
4,5
4,0
3,5
3,0
2,5
2,0
1,5
1,0
0,5
0,0
new moon
waxing
full moon
waning
-- roots
-- leaves
1 3 5 7 9 11 13 15 17 19 21 23 25 27 29
FIGURE 11.1 Fresh mass of roots and leaves (kg, Y-axis) for the different dates of sowing (X-axis) in 2005.
New Moon
Waxing
Full Moon
Waning
-- roots
-- leaves
-- dry mass
FIGURE 11.2 The per cent deviation from the trend line of the fresh root and leaf mass and dry mass of roots
(Y-axis) for the different sowing dates (X-axis) in 2005.