

119
Epigenetic Regulation of Protein Synthesis
to the genodic sequences. Batches that received no diffusion had a rate of second grade of around
6% (±1.5%); then, this rate decreases with diffusion time until it reaches the minimum value around
of 2.5% (±0.5%) for a maximum diffusion time of 400 minutes spread over the duration of the forcing (20 minutes each day). The linear regression of these points shows a reduction by a factor of 2,
between no diffusion (6%) and 400 minutes of diffusion (3%). In Figure 10.5b, there is an insignifcant increase in performance as a function of the duration of exposure to the sequences. The high
variability for the production of each batch results in a large confdence interval (between ±5 and
±10 kg/container, although a (insignifcant) trend towards increased yield can be observed by linear
regression of the data.
Case 4: Reduction of the impact of Mosaic Virus on courgettes.
(Actual distances from the tunnels on the device are as follows: 20, 30, …, 80 m.)
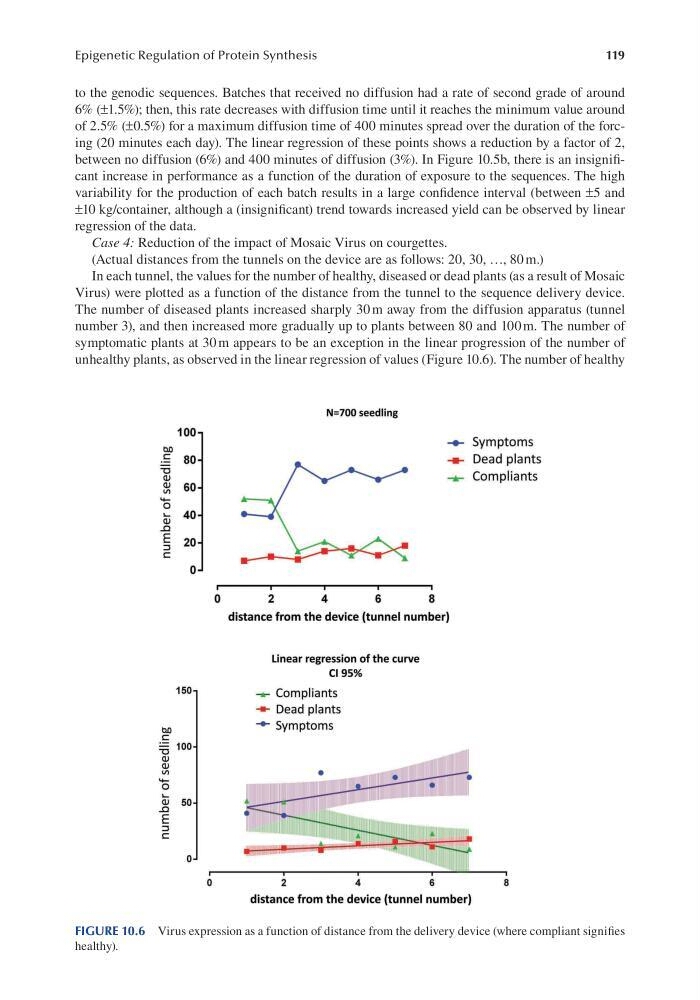
In each tunnel, the values for the number of healthy, diseased or dead plants (as a result of Mosaic
Virus) were plotted as a function of the distance from the tunnel to the sequence delivery device.
The number of diseased plants increased sharply 30 m away from the diffusion apparatus (tunnel
number 3), and then increased more gradually up to plants between 80 and 100 m. The number of
symptomatic plants at 30 m appears to be an exception in the linear progression of the number of
unhealthy plants, as observed in the linear regression of values (Figure 10.6). The number of healthy
FIGURE 10.6 Virus expression as a function of distance from the delivery device (where compliant signifes
healthy).