

118
Subtle Agroecologies
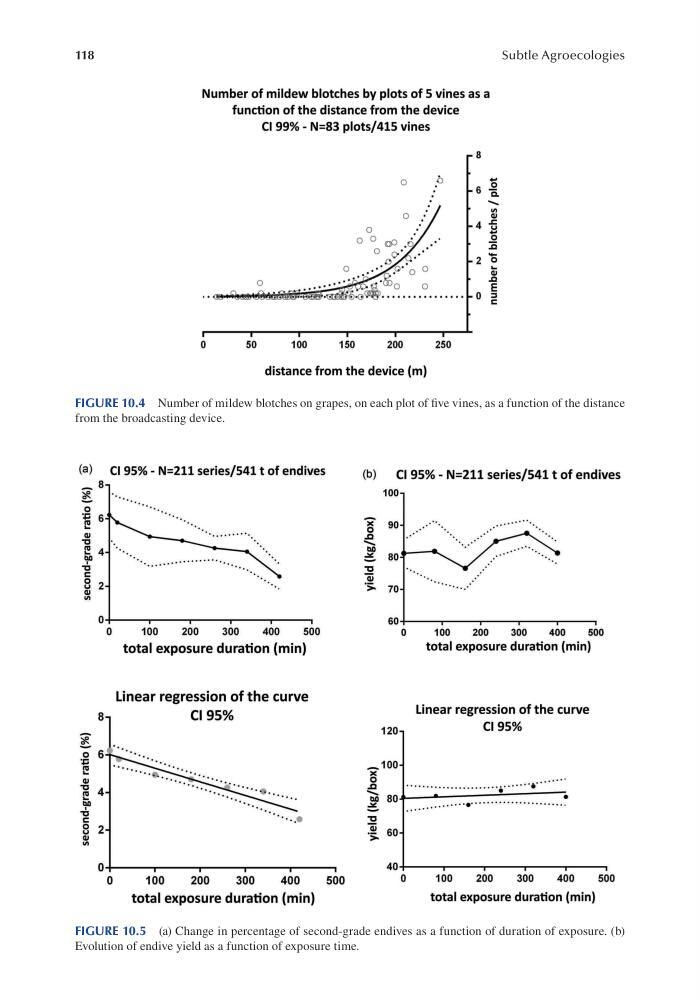
FIGURE 10.4 Number of mildew blotches on grapes, on each plot of fve vines, as a function of the distance
from the broadcasting device.
FIGURE 10.5 (a) Change in percentage of second-grade endives as a function of duration of exposure. (b)
Evolution of endive yield as a function of exposure time.