

116
Subtle Agroecologies
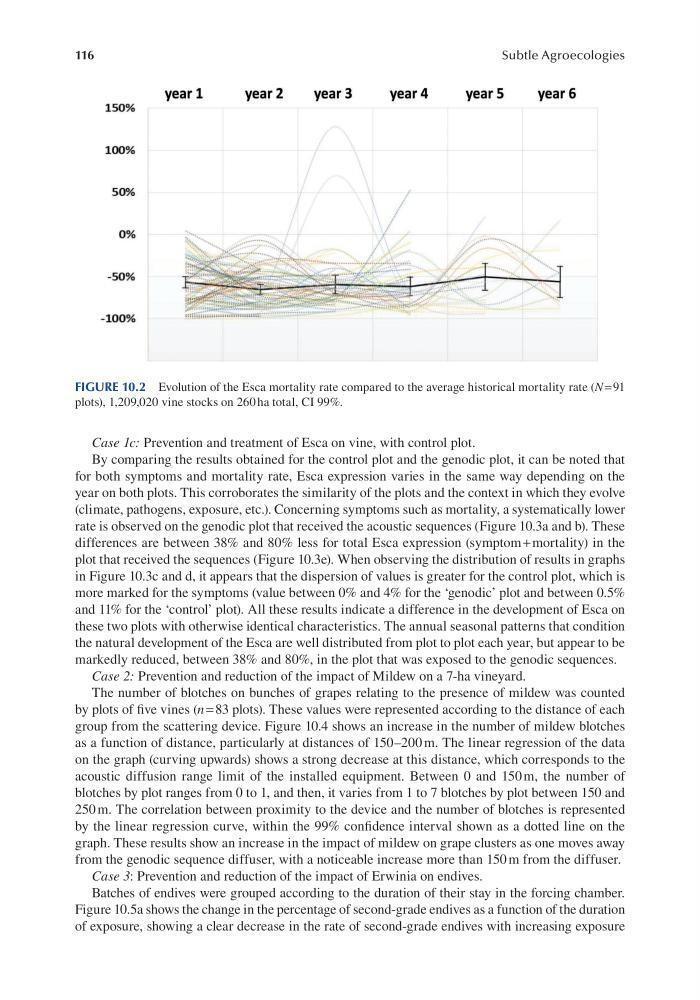
FIGURE 10.2 Evolution of the Esca mortality rate compared to the average historical mortality rate (N = 91
plots), 1,209,020 vine stocks on 260 ha total, CI 99%.
Case 1c: Prevention and treatment of Esca on vine, with control plot.
By comparing the results obtained for the control plot and the genodic plot, it can be noted that
for both symptoms and mortality rate, Esca expression varies in the same way depending on the
year on both plots. This corroborates the similarity of the plots and the context in which they evolve
(climate, pathogens, exposure, etc.). Concerning symptoms such as mortality, a systematically lower
rate is observed on the genodic plot that received the acoustic sequences (Figure 10.3a and b). These
differences are between 38% and 80% less for total Esca expression (symptom + mortality) in the
plot that received the sequences (Figure 10.3e). When observing the distribution of results in graphs
in Figure 10.3c and d, it appears that the dispersion of values is greater for the control plot, which is
more marked for the symptoms (value between 0% and 4% for the ‘genodic’ plot and between 0.5%
and 11% for the ‘control’ plot). All these results indicate a difference in the development of Esca on
these two plots with otherwise identical characteristics. The annual seasonal patterns that condition
the natural development of the Esca are well distributed from plot to plot each year, but appear to be
markedly reduced, between 38% and 80%, in the plot that was exposed to the genodic sequences.
Case 2: Prevention and reduction of the impact of Mildew on a 7-ha vineyard.
The number of blotches on bunches of grapes relating to the presence of mildew was counted
by plots of fve vines (n = 83 plots). These values were represented according to the distance of each
group from the scattering device. Figure 10.4 shows an increase in the number of mildew blotches
as a function of distance, particularly at distances of 150–200 m. The linear regression of the data
on the graph (curving upwards) shows a strong decrease at this distance, which corresponds to the
acoustic diffusion range limit of the installed equipment. Between 0 and 150 m, the number of
blotches by plot ranges from 0 to 1, and then, it varies from 1 to 7 blotches by plot between 150 and
250 m. The correlation between proximity to the device and the number of blotches is represented
by the linear regression curve, within the 99% confdence interval shown as a dotted line on the
graph. These results show an increase in the impact of mildew on grape clusters as one moves away
from the genodic sequence diffuser, with a noticeable increase more than 150 m from the diffuser.
Case 3: Prevention and reduction of the impact of Erwinia on endives.
Batches of endives were grouped according to the duration of their stay in the forcing chamber.
Figure 10.5a shows the change in the percentage of second-grade endives as a function of the duration
of exposure, showing a clear decrease in the rate of second-grade endives with increasing exposure