

115
Epigenetic Regulation of Protein Synthesis
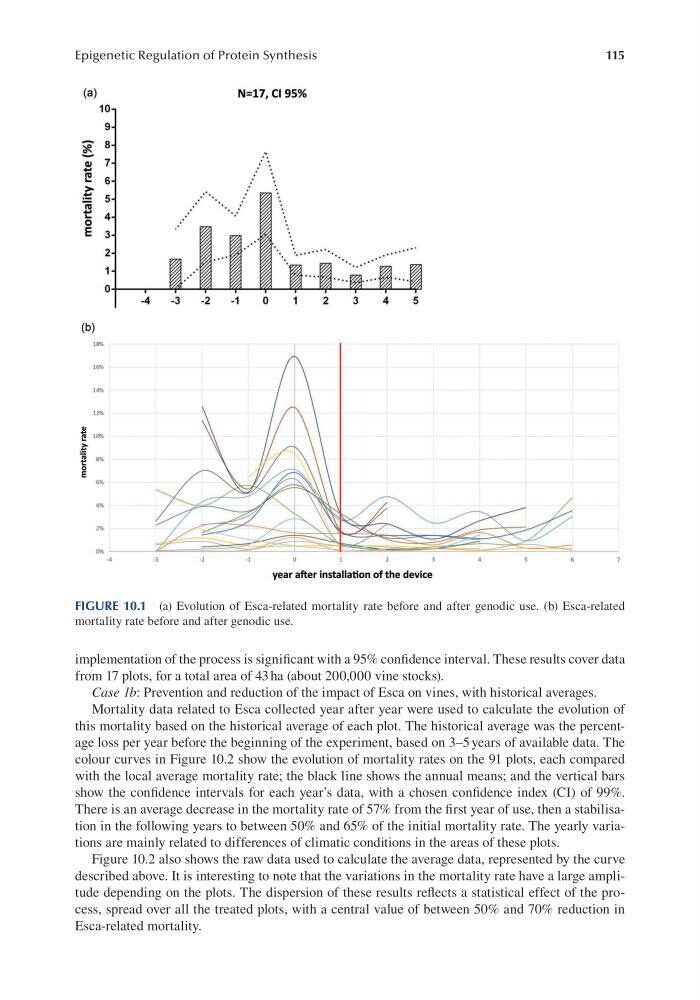
FIGURE 10.1 (a) Evolution of Esca-related mortality rate before and after genodic use. (b) Esca-related
mortality rate before and after genodic use.
implementation of the process is signifcant with a 95% confdence interval. These results cover data
from 17 plots, for a total area of 43 ha (about 200,000 vine stocks).
Case 1b: Prevention and reduction of the impact of Esca on vines, with historical averages.
Mortality data related to Esca collected year after year were used to calculate the evolution of
this mortality based on the historical average of each plot. The historical average was the percentage loss per year before the beginning of the experiment, based on 3–5 years of available data. The
colour curves in Figure 10.2 show the evolution of mortality rates on the 91 plots, each compared
with the local average mortality rate; the black line shows the annual means; and the vertical bars
show the confdence intervals for each year’s data, with a chosen confdence index (CI) of 99%.
There is an average decrease in the mortality rate of 57% from the frst year of use, then a stabilisation in the following years to between 50% and 65% of the initial mortality rate. The yearly variations are mainly related to differences of climatic conditions in the areas of these plots.
Figure 10.2 also shows the raw data used to calculate the average data, represented by the curve
described above. It is interesting to note that the variations in the mortality rate have a large amplitude depending on the plots. The dispersion of these results refects a statistical effect of the process, spread over all the treated plots, with a central value of between 50% and 70% reduction in
Esca-related mortality.