

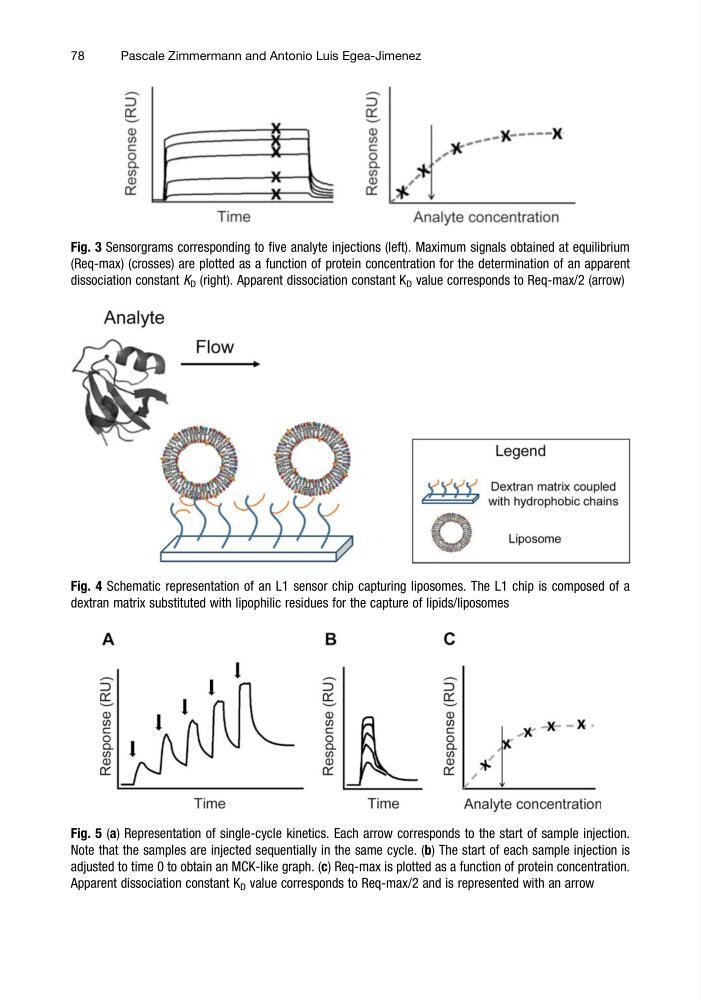
Fig. 3 Sensorgrams corresponding to five analyte injections (left). Maximum signals obtained at equilibrium
(Req-max) (crosses) are plotted as a function of protein concentration for the determination of an apparent
dissociation constant K D (right). Apparent dissociation constant K D value corresponds to Req-max/2 (arrow)
Fig. 4 Schematic representation of an L1 sensor chip capturing liposomes. The L1 chip is composed of a
dextran matrix substituted with lipophilic residues for the capture of lipids/liposomes
Fig. 5 (a) Representation of single-cycle kinetics. Each arrow corresponds to the start of sample injection.
Note that the samples are injected sequentially in the same cycle. (b) The start of each sample injection is
adjusted to time 0 to obtain an MCK-like graph. (c) Req-max is plotted as a function of protein concentration.
Apparent dissociation constant K D value corresponds to Req-max/2 and is represented with an arrow
78
Pascale Zimmermann and Antonio Luis Egea-Jimenez
(Req-max) (crosses) are plotted as a function of protein concentration for the determination of an apparent
dissociation constant K D (right). Apparent dissociation constant K D value corresponds to Req-max/2 (arrow)
Fig. 4 Schematic representation of an L1 sensor chip capturing liposomes. The L1 chip is composed of a
dextran matrix substituted with lipophilic residues for the capture of lipids/liposomes
Fig. 5 (a) Representation of single-cycle kinetics. Each arrow corresponds to the start of sample injection.
Note that the samples are injected sequentially in the same cycle. (b) The start of each sample injection is
adjusted to time 0 to obtain an MCK-like graph. (c) Req-max is plotted as a function of protein concentration.
Apparent dissociation constant K D value corresponds to Req-max/2 and is represented with an arrow
78
Pascale Zimmermann and Antonio Luis Egea-Jimenez