

1. Baseline subtraction in the raw data electropherograms.
2. Normalization of the peak intensities by the use of the added
internal control.
3. X-axis adjustment of the sample electropherogram to the reference one by performing a linear transformation (translation
and dilation).
4. “Secondary” correction of the signal intensities (optional).
5. BI determination deduced from superimposing the electropherograms and calculating the depletion of the peak for the
protein of interest.
The standardization of electropherogram processing leads ultimately to a better comparison and reproducibility between different holdup assays, no matter if performed in the same laboratory or
not. A nice example of the power of applying these strategies can be
found in recent publications, in which we achieved highly accurate
and reproducible results [8, 11].
Although the holdup assay is in principle adaptable to study
diverse binding protein–ligand systems, here we will focus on the
human PDZ domain (the PDZome)–PBM interactions.
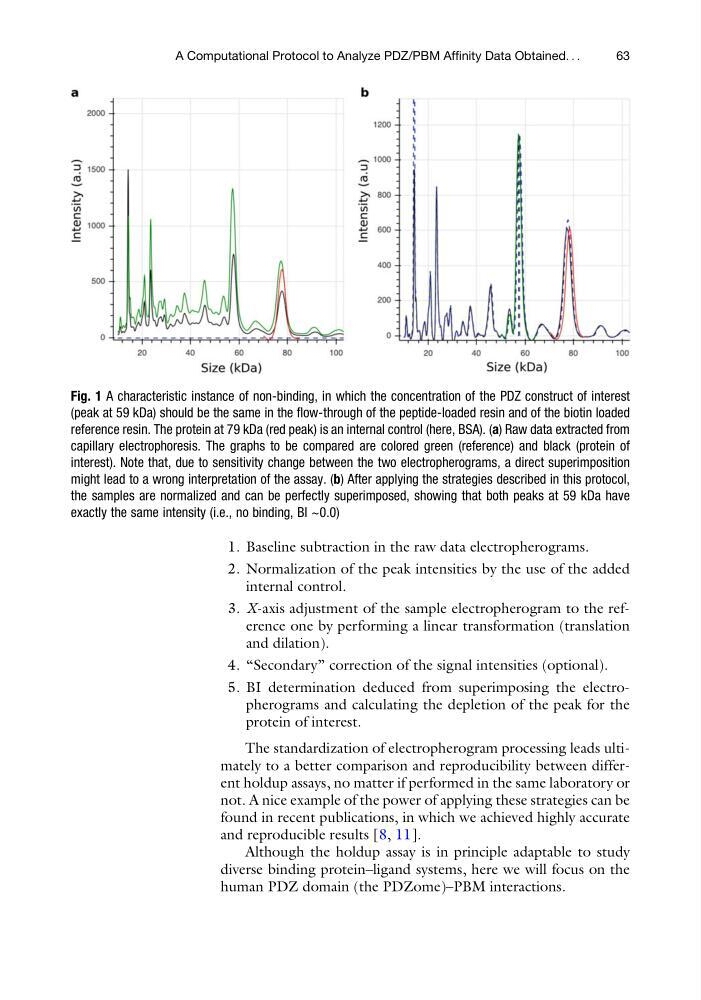
Fig. 1 A characteristic instance of non-binding, in which the concentration of the PDZ construct of interest
(peak at 59 kDa) should be the same in the flow-through of the peptide-loaded resin and of the biotin loaded
reference resin. The protein at 79 kDa (red peak) is an internal control (here, BSA). (a) Raw data extracted from
capillary electrophoresis. The graphs to be compared are colored green (reference) and black (protein of
interest). Note that, due to sensitivity change between the two electropherograms, a direct superimposition
might lead to a wrong interpretation of the assay. (b) After applying the strategies described in this protocol,
the samples are normalized and can be perfectly superimposed, showing that both peaks at 59 kDa have
exactly the same intensity (i.e., no binding, BI ~0.0)
A Computational Protocol to Analyze PDZ/PBM Affinity Data Obtained. . .
63
2. Normalization of the peak intensities by the use of the added
internal control.
3. X-axis adjustment of the sample electropherogram to the reference one by performing a linear transformation (translation
and dilation).
4. “Secondary” correction of the signal intensities (optional).
5. BI determination deduced from superimposing the electropherograms and calculating the depletion of the peak for the
protein of interest.
The standardization of electropherogram processing leads ultimately to a better comparison and reproducibility between different holdup assays, no matter if performed in the same laboratory or
not. A nice example of the power of applying these strategies can be
found in recent publications, in which we achieved highly accurate
and reproducible results [8, 11].
Although the holdup assay is in principle adaptable to study
diverse binding protein–ligand systems, here we will focus on the
human PDZ domain (the PDZome)–PBM interactions.
Fig. 1 A characteristic instance of non-binding, in which the concentration of the PDZ construct of interest
(peak at 59 kDa) should be the same in the flow-through of the peptide-loaded resin and of the biotin loaded
reference resin. The protein at 79 kDa (red peak) is an internal control (here, BSA). (a) Raw data extracted from
capillary electrophoresis. The graphs to be compared are colored green (reference) and black (protein of
interest). Note that, due to sensitivity change between the two electropherograms, a direct superimposition
might lead to a wrong interpretation of the assay. (b) After applying the strategies described in this protocol,
the samples are normalized and can be perfectly superimposed, showing that both peaks at 59 kDa have
exactly the same intensity (i.e., no binding, BI ~0.0)
A Computational Protocol to Analyze PDZ/PBM Affinity Data Obtained. . .
63