

for the overall structure during microsecond MD runs, and with
experimental backbone amide order parameters, which measure
conformational fluctuations.
We modeled PDZ–peptide complexes based on X-ray structures involving four peptides: Sdc1, Caspr4, Neurexin, and a “consensus” peptide from a combinatorial peptide library [45]. The
peptides were bound to either the wild-type Tiam1 PDZ domain
(WT) or a variant containing four amino acid changes (quadruple
mutant or QM). The four complexes were WT–Sdc1 (PDB 4GVD)
[33], WT–consensus (PDB 3KZE) [46], QM–Caspr4 (PDB
4NXQ) [47], and QM–Neurexin (PDB 4NXR) [47].
Our truncated icosahedral simulation box included around
10,900 water molecules. Each PDZ–peptide variant was prepared
by immersing it in the same solvent box, deleting overlapping
waters, and running about 500 ps of equilibration at room temperature with gradually decreasing harmonic restraints, initially on all
solute atoms and finally on only backbone C α ’s. Structure preparation was done with the protX module of Proteus, while equilibration was done with NAMD. Other programs can also be used, such
as Charmm, Amber, or Gromacs. MD production was run for
40 ns, then continued until the free energy function converged or
100 ns were reached. This took up to 2 days on a single GPU
processor.
3.2 Relative Binding
Free Energies
3.2.1 The Free Energy
Function
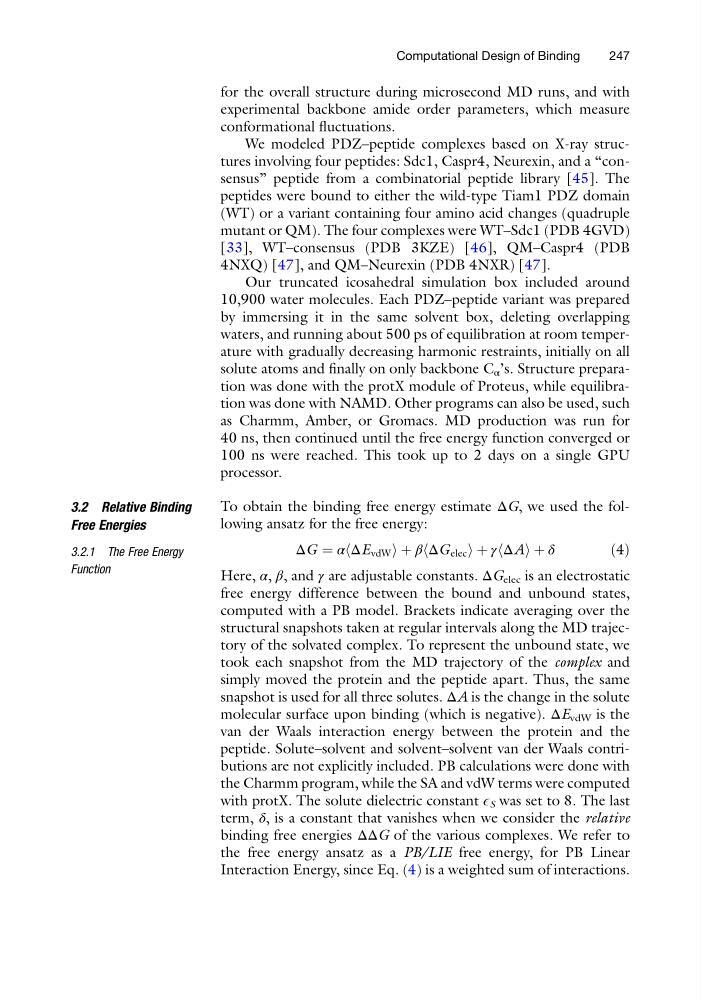
To obtain the binding free energy estimate ΔG, we used the following ansatz for the free energy:
ΔG ¼ α ΔE vdW
h
iþ β ΔG elec
h
iþ γ ΔA
h
iþ δ
ð4Þ
Here, α, β, and γ are adjustable constants. ΔG elec is an electrostatic
free energy difference between the bound and unbound states,
computed with a PB model. Brackets indicate averaging over the
structural snapshots taken at regular intervals along the MD trajectory of the solvated complex. To represent the unbound state, we
took each snapshot from the MD trajectory of the complex and
simply moved the protein and the peptide apart. Thus, the same
snapshot is used for all three solutes. ΔA is the change in the solute
molecular surface upon binding (which is negative). ΔE vdW is the
van der Waals interaction energy between the protein and the
peptide. Solute–solvent and solvent–solvent van der Waals contributions are not explicitly included. PB calculations were done with
the Charmm program, while the SA and vdW terms were computed
with protX. The solute dielectric constant ϵ S was set to 8. The last
term, δ, is a constant that vanishes when we consider the relative
binding free energies ΔΔG of the various complexes. We refer to
the free energy ansatz as a PB/LIE free energy, for PB Linear
Interaction Energy, since Eq. (4) is a weighted sum of interactions.
Computational Design of Binding
247
experimental backbone amide order parameters, which measure
conformational fluctuations.
We modeled PDZ–peptide complexes based on X-ray structures involving four peptides: Sdc1, Caspr4, Neurexin, and a “consensus” peptide from a combinatorial peptide library [45]. The
peptides were bound to either the wild-type Tiam1 PDZ domain
(WT) or a variant containing four amino acid changes (quadruple
mutant or QM). The four complexes were WT–Sdc1 (PDB 4GVD)
[33], WT–consensus (PDB 3KZE) [46], QM–Caspr4 (PDB
4NXQ) [47], and QM–Neurexin (PDB 4NXR) [47].
Our truncated icosahedral simulation box included around
10,900 water molecules. Each PDZ–peptide variant was prepared
by immersing it in the same solvent box, deleting overlapping
waters, and running about 500 ps of equilibration at room temperature with gradually decreasing harmonic restraints, initially on all
solute atoms and finally on only backbone C α ’s. Structure preparation was done with the protX module of Proteus, while equilibration was done with NAMD. Other programs can also be used, such
as Charmm, Amber, or Gromacs. MD production was run for
40 ns, then continued until the free energy function converged or
100 ns were reached. This took up to 2 days on a single GPU
processor.
3.2 Relative Binding
Free Energies
3.2.1 The Free Energy
Function
To obtain the binding free energy estimate ΔG, we used the following ansatz for the free energy:
ΔG ¼ α ΔE vdW
h
iþ β ΔG elec
h
iþ γ ΔA
h
iþ δ
ð4Þ
Here, α, β, and γ are adjustable constants. ΔG elec is an electrostatic
free energy difference between the bound and unbound states,
computed with a PB model. Brackets indicate averaging over the
structural snapshots taken at regular intervals along the MD trajectory of the solvated complex. To represent the unbound state, we
took each snapshot from the MD trajectory of the complex and
simply moved the protein and the peptide apart. Thus, the same
snapshot is used for all three solutes. ΔA is the change in the solute
molecular surface upon binding (which is negative). ΔE vdW is the
van der Waals interaction energy between the protein and the
peptide. Solute–solvent and solvent–solvent van der Waals contributions are not explicitly included. PB calculations were done with
the Charmm program, while the SA and vdW terms were computed
with protX. The solute dielectric constant ϵ S was set to 8. The last
term, δ, is a constant that vanishes when we consider the relative
binding free energies ΔΔG of the various complexes. We refer to
the free energy ansatz as a PB/LIE free energy, for PB Linear
Interaction Energy, since Eq. (4) is a weighted sum of interactions.
Computational Design of Binding
247