

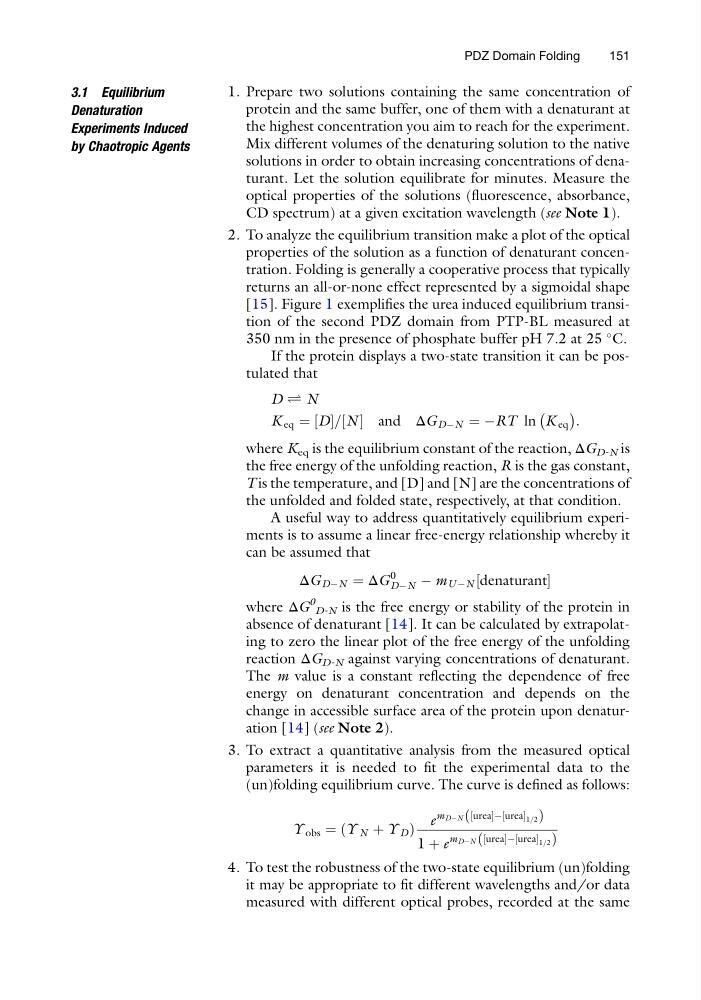
3.1 Equilibrium
Denaturation
Experiments Induced
by Chaotropic Agents
1. Prepare two solutions containing the same concentration of
protein and the same buffer, one of them with a denaturant at
the highest concentration you aim to reach for the experiment.
Mix different volumes of the denaturing solution to the native
solutions in order to obtain increasing concentrations of denaturant. Let the solution equilibrate for minutes. Measure the
optical properties of the solutions (fluorescence, absorbance,
CD spectrum) at a given excitation wavelength (see Note 1).
2. To analyze the equilibrium transition make a plot of the optical
properties of the solution as a function of denaturant concentration. Folding is generally a cooperative process that typically
returns an all-or-none effect represented by a sigmoidal shape
[15]. Figure 1 exemplifies the urea induced equilibrium transition of the second PDZ domain from PTP-BL measured at
350 nm in the presence of phosphate buffer pH 7.2 at 25
C.
If the protein displays a two-state transition it can be postulated that
D Ð N
K eq ¼ D
½ = N
½ and ΔG DÀN ¼ ÀRT ln K eq
À
Á
:
where K eq is the equilibrium constant of the reaction, ΔG D-N is
the free energy of the unfolding reaction, R is the gas constant,
T is the temperature, and [D] and [N] are the concentrations of
the unfolded and folded state, respectively, at that condition.
A useful way to address quantitatively equilibrium experiments is to assume a linear free-energy relationship whereby it
can be assumed that
ΔG DÀN ¼ ΔG
0
DÀN À m U ÀN denaturant
½
where ΔG
0
D-N is the free energy or stability of the protein in
absence of denaturant [14]. It can be calculated by extrapolating to zero the linear plot of the free energy of the unfolding
reaction ΔG D-N against varying concentrations of denaturant.
The m value is a constant reflecting the dependence of free
energy on denaturant concentration and depends on the
change in accessible surface area of the protein upon denaturation [14] (see Note 2).
3. To extract a quantitative analysis from the measured optical
parameters it is needed to fit the experimental data to the
(un)folding equilibrium curve. The curve is defined as follows:
Y obs ¼ Y N þ Y D
ð
Þ
e
m DÀN urea
½
Àurea ½
1=2
ð
Þ
1 þ e
m DÀN urea
½
Àurea ½
1=2
ð
Þ
4. To test the robustness of the two-state equilibrium (un)folding
it may be appropriate to fit different wavelengths and/or data
measured with different optical probes, recorded at the same
PDZ Domain Folding
151
Denaturation
Experiments Induced
by Chaotropic Agents
1. Prepare two solutions containing the same concentration of
protein and the same buffer, one of them with a denaturant at
the highest concentration you aim to reach for the experiment.
Mix different volumes of the denaturing solution to the native
solutions in order to obtain increasing concentrations of denaturant. Let the solution equilibrate for minutes. Measure the
optical properties of the solutions (fluorescence, absorbance,
CD spectrum) at a given excitation wavelength (see Note 1).
2. To analyze the equilibrium transition make a plot of the optical
properties of the solution as a function of denaturant concentration. Folding is generally a cooperative process that typically
returns an all-or-none effect represented by a sigmoidal shape
[15]. Figure 1 exemplifies the urea induced equilibrium transition of the second PDZ domain from PTP-BL measured at
350 nm in the presence of phosphate buffer pH 7.2 at 25
C.
If the protein displays a two-state transition it can be postulated that
D Ð N
K eq ¼ D
½ = N
½ and ΔG DÀN ¼ ÀRT ln K eq
À
Á
:
where K eq is the equilibrium constant of the reaction, ΔG D-N is
the free energy of the unfolding reaction, R is the gas constant,
T is the temperature, and [D] and [N] are the concentrations of
the unfolded and folded state, respectively, at that condition.
A useful way to address quantitatively equilibrium experiments is to assume a linear free-energy relationship whereby it
can be assumed that
ΔG DÀN ¼ ΔG
0
DÀN À m U ÀN denaturant
½
where ΔG
0
D-N is the free energy or stability of the protein in
absence of denaturant [14]. It can be calculated by extrapolating to zero the linear plot of the free energy of the unfolding
reaction ΔG D-N against varying concentrations of denaturant.
The m value is a constant reflecting the dependence of free
energy on denaturant concentration and depends on the
change in accessible surface area of the protein upon denaturation [14] (see Note 2).
3. To extract a quantitative analysis from the measured optical
parameters it is needed to fit the experimental data to the
(un)folding equilibrium curve. The curve is defined as follows:
Y obs ¼ Y N þ Y D
ð
Þ
e
m DÀN urea
½
Àurea ½
1=2
ð
Þ
1 þ e
m DÀN urea
½
Àurea ½
1=2
ð
Þ
4. To test the robustness of the two-state equilibrium (un)folding
it may be appropriate to fit different wavelengths and/or data
measured with different optical probes, recorded at the same
PDZ Domain Folding
151