

[32]. Several techniques can be used to monitor the thermostability
of the sample such as: CD coupled to a temperature gradient that
monitors the loss of secondary structure as a sign of global unfolding [29], DSF that detects changes in the tryptophan and tyrosine
environment, as well as thermofluor and DSC [33]. All these
approaches are based on partial or full unfolding of proteins during
heat denaturation. These techniques use different observable data
to monitor protein unfolding that could lead to a sharp modification of the signal over a short temperature range. The melting
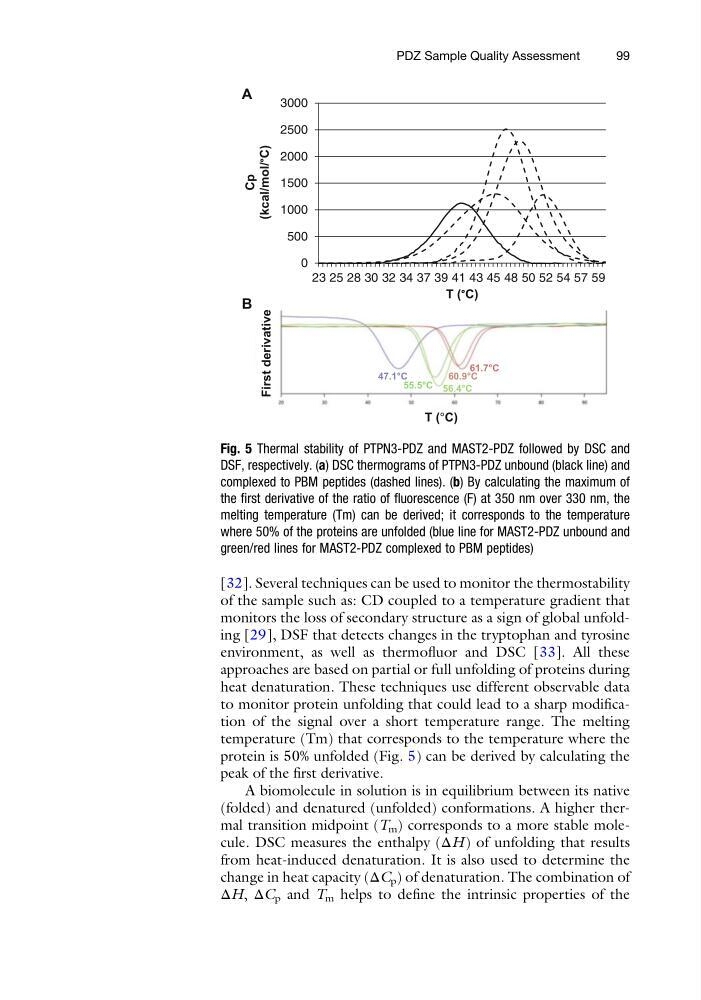
temperature (Tm) that corresponds to the temperature where the
protein is 50% unfolded (Fig. 5) can be derived by calculating the
peak of the first derivative.
A biomolecule in solution is in equilibrium between its native
(folded) and denatured (unfolded) conformations. A higher thermal transition midpoint (T m ) corresponds to a more stable molecule. DSC measures the enthalpy (ΔH) of unfolding that results
from heat-induced denaturation. It is also used to determine the
change in heat capacity (ΔC p ) of denaturation. The combination of
ΔH, ΔC p and T m helps to define the intrinsic properties of the
41°C
47°C
49°C
52°C
45°C
Cp (10 3
kcal/mole/°C)
T (°C)
47°C
47.1°C
61.7°C
60.9°C
55.5°C 56.4°C
0
500
1000
1500
2000
2500
3000
23 25 28 30 32 34 37 39 41 43 45 48 50 52 54 57 59
Cp
(kcal/mol/°C)
T (°C)
T (°C)
First derivative
A
B
Fig. 5 Thermal stability of PTPN3-PDZ and MAST2-PDZ followed by DSC and
DSF, respectively. (a) DSC thermograms of PTPN3-PDZ unbound (black line) and
complexed to PBM peptides (dashed lines). (b) By calculating the maximum of
the first derivative of the ratio of fluorescence (F) at 350 nm over 330 nm, the
melting temperature (Tm) can be derived; it corresponds to the temperature
where 50% of the proteins are unfolded (blue line for MAST2-PDZ unbound and
green/red lines for MAST2-PDZ complexed to PBM peptides)
PDZ Sample Quality Assessment
99
of the sample such as: CD coupled to a temperature gradient that
monitors the loss of secondary structure as a sign of global unfolding [29], DSF that detects changes in the tryptophan and tyrosine
environment, as well as thermofluor and DSC [33]. All these
approaches are based on partial or full unfolding of proteins during
heat denaturation. These techniques use different observable data
to monitor protein unfolding that could lead to a sharp modification of the signal over a short temperature range. The melting
temperature (Tm) that corresponds to the temperature where the
protein is 50% unfolded (Fig. 5) can be derived by calculating the
peak of the first derivative.
A biomolecule in solution is in equilibrium between its native
(folded) and denatured (unfolded) conformations. A higher thermal transition midpoint (T m ) corresponds to a more stable molecule. DSC measures the enthalpy (ΔH) of unfolding that results
from heat-induced denaturation. It is also used to determine the
change in heat capacity (ΔC p ) of denaturation. The combination of
ΔH, ΔC p and T m helps to define the intrinsic properties of the
41°C
47°C
49°C
52°C
45°C
Cp (10 3
kcal/mole/°C)
T (°C)
47°C
47.1°C
61.7°C
60.9°C
55.5°C 56.4°C
0
500
1000
1500
2000
2500
3000
23 25 28 30 32 34 37 39 41 43 45 48 50 52 54 57 59
Cp
(kcal/mol/°C)
T (°C)
T (°C)
First derivative
A
B
Fig. 5 Thermal stability of PTPN3-PDZ and MAST2-PDZ followed by DSC and
DSF, respectively. (a) DSC thermograms of PTPN3-PDZ unbound (black line) and
complexed to PBM peptides (dashed lines). (b) By calculating the maximum of
the first derivative of the ratio of fluorescence (F) at 350 nm over 330 nm, the
melting temperature (Tm) can be derived; it corresponds to the temperature
where 50% of the proteins are unfolded (blue line for MAST2-PDZ unbound and
green/red lines for MAST2-PDZ complexed to PBM peptides)
PDZ Sample Quality Assessment
99