

3.9 Data Analysis
for High-Content
Microscopy
Experiments
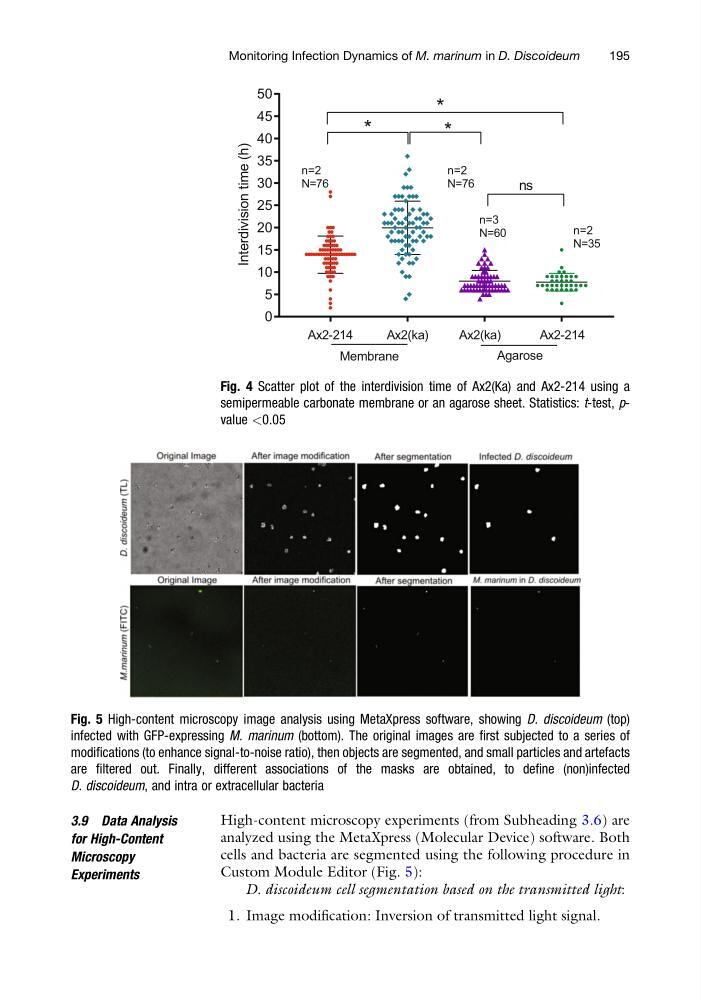
High-content microscopy experiments (from Subheading 3.6) are
analyzed using the MetaXpress (Molecular Device) software. Both
cells and bacteria are segmented using the following procedure in
Custom Module Editor (Fig. 5):
D. discoideum cell segmentation based on the transmitted light:
1. Image modification: Inversion of transmitted light signal.
0
5
10
15
20
25
30
35
40
45
50
Interdivision time (h)
n=2
N=76
n=2
N=76
n=3
N=60
*
*
n=2
N=35
*
ns
Ax2-214
Ax2-214
Ax2(ka)
Ax2(ka)
Membrane
Agarose
Fig. 4 Scatter plot of the interdivision time of Ax2(Ka) and Ax2-214 using a
semipermeable carbonate membrane or an agarose sheet. Statistics: t-test, pvalue <0.05
Fig. 5 High-content microscopy image analysis using MetaXpress software, showing D. discoideum (top)
infected with GFP-expressing M. marinum (bottom). The original images are first subjected to a series of
modifications (to enhance signal-to-noise ratio), then objects are segmented, and small particles and artefacts
are filtered out. Finally, different associations of the masks are obtained, to define (non)infected
D. discoideum, and intra or extracellular bacteria
Monitoring Infection Dynamics of M. marinum in D. Discoideum
195
for High-Content
Microscopy
Experiments
High-content microscopy experiments (from Subheading 3.6) are
analyzed using the MetaXpress (Molecular Device) software. Both
cells and bacteria are segmented using the following procedure in
Custom Module Editor (Fig. 5):
D. discoideum cell segmentation based on the transmitted light:
1. Image modification: Inversion of transmitted light signal.
0
5
10
15
20
25
30
35
40
45
50
Interdivision time (h)
n=2
N=76
n=2
N=76
n=3
N=60
*
*
n=2
N=35
*
ns
Ax2-214
Ax2-214
Ax2(ka)
Ax2(ka)
Membrane
Agarose
Fig. 4 Scatter plot of the interdivision time of Ax2(Ka) and Ax2-214 using a
semipermeable carbonate membrane or an agarose sheet. Statistics: t-test, pvalue <0.05
Fig. 5 High-content microscopy image analysis using MetaXpress software, showing D. discoideum (top)
infected with GFP-expressing M. marinum (bottom). The original images are first subjected to a series of
modifications (to enhance signal-to-noise ratio), then objects are segmented, and small particles and artefacts
are filtered out. Finally, different associations of the masks are obtained, to define (non)infected
D. discoideum, and intra or extracellular bacteria
Monitoring Infection Dynamics of M. marinum in D. Discoideum
195