

7. Go to the spinning disc microscope, set the temperature control to 22
C (see Note 13), use the 10Â objective, transmitted
light, laser lines 488 and 561 nm.
(a) Use tile scans, e.g., 5 Â 5, to increase the probability to
observe a complete aggregate in the field of view.
(b) Image every 15 min in sequential mode to avoid fluorescence bleed-through.
(c) Keep laser exposure as low as possible.
(d) Image for at least 15 h.
(e) Use the stitching method implemented in the SlideBook
software to create a single field of view from the tile scan.
(f) Export image files in the tiff-format for processing and
analysis.
3.8 Data Analysis
for Single Cell
Experiments
1. View the movies (from Subheading 3.5) frame-by-frame with
the microscope software SlideBook.
2. Note every event (cell division or death, bacteria release or
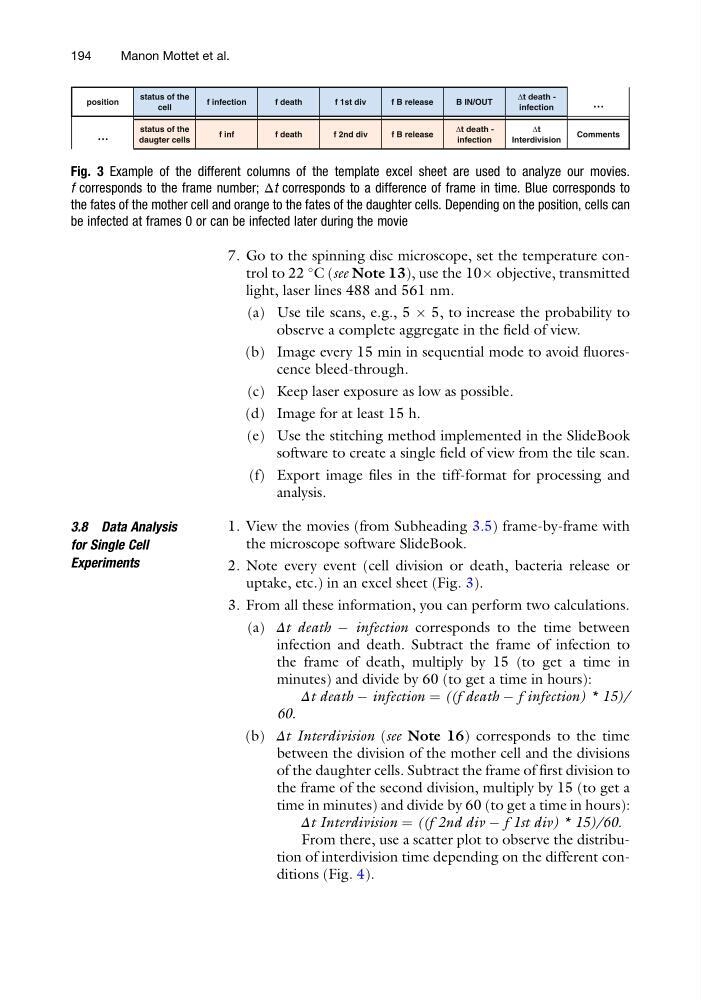
uptake, etc.) in an excel sheet (Fig. 3).
3. From all these information, you can perform two calculations.
(a) Δt death À infection corresponds to the time between
infection and death. Subtract the frame of infection to
the frame of death, multiply by 15 (to get a time in
minutes) and divide by 60 (to get a time in hours):
Δt death À infection ¼ ((f death À f infection) * 15)/
60.
(b) Δt Interdivision (see Note 16) corresponds to the time
between the division of the mother cell and the divisions
of the daughter cells. Subtract the frame of first division to
the frame of the second division, multiply by 15 (to get a
time in minutes) and divide by 60 (to get a time in hours):
Δt Interdivision ¼ ((f 2nd div À f 1st div) * 15)/60.
From there, use a scatter plot to observe the distribution of interdivision time depending on the different conditions (Fig. 4).
position
status of the
cell
f infection
f death
f 1st div
f B release
B IN/OUT
Δt death -
infection
…
…
status of the
daugter cells
f inf
f death
f 2nd div
f B release
Δt death -
infection
Δt
Interdivision
Comments
Fig. 3 Example of the different columns of the template excel sheet are used to analyze our movies.
f corresponds to the frame number; Δt corresponds to a difference of frame in time. Blue corresponds to
the fates of the mother cell and orange to the fates of the daughter cells. Depending on the position, cells can
be infected at frames 0 or can be infected later during the movie
194
Manon Mottet et al.
C (see Note 13), use the 10Â objective, transmitted
light, laser lines 488 and 561 nm.
(a) Use tile scans, e.g., 5 Â 5, to increase the probability to
observe a complete aggregate in the field of view.
(b) Image every 15 min in sequential mode to avoid fluorescence bleed-through.
(c) Keep laser exposure as low as possible.
(d) Image for at least 15 h.
(e) Use the stitching method implemented in the SlideBook
software to create a single field of view from the tile scan.
(f) Export image files in the tiff-format for processing and
analysis.
3.8 Data Analysis
for Single Cell
Experiments
1. View the movies (from Subheading 3.5) frame-by-frame with
the microscope software SlideBook.
2. Note every event (cell division or death, bacteria release or
uptake, etc.) in an excel sheet (Fig. 3).
3. From all these information, you can perform two calculations.
(a) Δt death À infection corresponds to the time between
infection and death. Subtract the frame of infection to
the frame of death, multiply by 15 (to get a time in
minutes) and divide by 60 (to get a time in hours):
Δt death À infection ¼ ((f death À f infection) * 15)/
60.
(b) Δt Interdivision (see Note 16) corresponds to the time
between the division of the mother cell and the divisions
of the daughter cells. Subtract the frame of first division to
the frame of the second division, multiply by 15 (to get a
time in minutes) and divide by 60 (to get a time in hours):
Δt Interdivision ¼ ((f 2nd div À f 1st div) * 15)/60.
From there, use a scatter plot to observe the distribution of interdivision time depending on the different conditions (Fig. 4).
position
status of the
cell
f infection
f death
f 1st div
f B release
B IN/OUT
Δt death -
infection
…
…
status of the
daugter cells
f inf
f death
f 2nd div
f B release
Δt death -
infection
Δt
Interdivision
Comments
Fig. 3 Example of the different columns of the template excel sheet are used to analyze our movies.
f corresponds to the frame number; Δt corresponds to a difference of frame in time. Blue corresponds to
the fates of the mother cell and orange to the fates of the daughter cells. Depending on the position, cells can
be infected at frames 0 or can be infected later during the movie
194
Manon Mottet et al.