

Processes 2018, 6, 134
2.4. Parameter Estimation
We have utilised parameterisations detailed in [10,15] to inform each of the models, respectively.
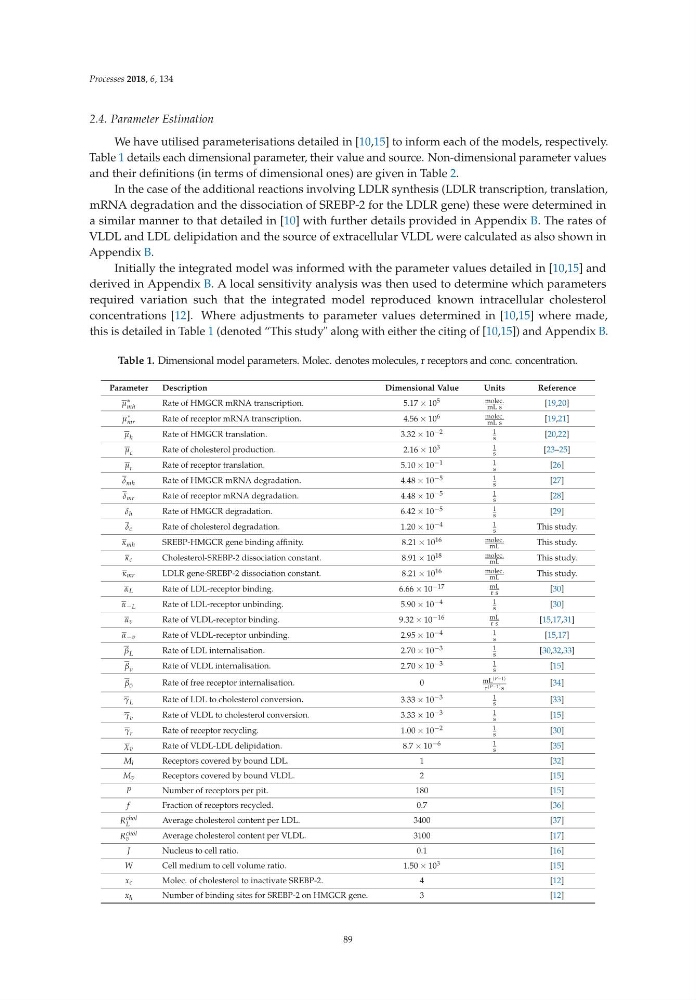
Table 1 details each dimensional parameter, their value and source. Non-dimensional parameter values
and their definitions (in terms of dimensional ones) are given in Table 2.
In the case of the additional reactions involving LDLR synthesis (LDLR transcription, translation,
mRNA degradation and the dissociation of SREBP-2 for the LDLR gene) these were determined in
a similar manner to that detailed in [10] with further details provided in Appendix B. The rates of
VLDL and LDL delipidation and the source of extracellular VLDL were calculated as also shown in
Appendix B.
Initially the integrated model was informed with the parameter values detailed in [10,15] and
derived in Appendix B. A local sensitivity analysis was then used to determine which parameters
required variation such that the integrated model reproduced known intracellular cholesterol
concentrations [12]. Where adjustments to parameter values determined in [10,15] where made,
this is detailed in Table 1 (denoted “This study" along with either the citing of [10,15]) and Appendix B.
Table 1. Dimensional model parameters. Molec. denotes molecules, r receptors and conc. concentration.
Parameter
Description
Dimensional Value
Units
Reference
μ ∗
mh
Rate of HMGCR mRNA transcription.
5.17 × 10 5
molec.
mL s
[19,20]
μ ∗
mr
Rate of receptor mRNA transcription.
4.56 × 10 6
molec.
mL s
[19,21]
μ h
Rate of HMGCR translation.
3.32 × 10 −2
1
s
[20,22]
μ c
Rate of cholesterol production.
2.16 × 10 3
1
s
[23–25]
μ r
Rate of receptor translation.
5.10 × 10 −1
1
s
[26]
δ mh
Rate of HMGCR mRNA degradation.
4.48 × 10 −5
1
s
[27]
δmr
Rate of receptor mRNA degradation.
4.48 × 10 −5
1
s
[28]
δ h
Rate of HMGCR degradation.
6.42 × 10 −5
1
s
[29]
δc
Rate of cholesterol degradation.
1.20 × 10 −4
1
s
This study.
κ mh
SREBP-HMGCR gene binding affinity.
8.21 × 10 16
molec.
mL
This study.
κc
Cholesterol-SREBP-2 dissociation constant.
8.91 × 10 18
molec.
mL
This study.
κmr
LDLR gene-SREBP-2 dissociation constant.
8.21 × 10 16
molec.
mL
This study.
α L
Rate of LDL-receptor binding.
6.66 × 10 −17
mL
rs
[30]
α −L
Rate of LDL-receptor unbinding.
5.90 × 10 −4
1
s
[30]
αv
Rate of VLDL-receptor binding.
9.32 × 10 −16
mL
rs
[15,17,31]
α−v
Rate of VLDL-receptor unbinding.
2.95 × 10 −4
1
s
[15,17]
β L
Rate of LDL internalisation.
2.70 × 10 −3
1
s
[30,32,33]
β v
Rate of VLDL internalisation.
2.70 × 10 −3
1
s
[15]
β 0
Rate of free receptor internalisation.
0
mL (P−1)
r (P−1) s
[34]
γ L
Rate of LDL to cholesterol conversion.
3.33 × 10 −3
1
s
[33]
γ v
Rate of VLDL to cholesterol conversion.
3.33 × 10 −3
1
s
[15]
γ r
Rate of receptor recycling.
1.00 × 10 −2
1
s
[30]
χ v
Rate of VLDL-LDL delipidation.
8.7 × 10 −6
1
s
[35]
M l
Receptors covered by bound LDL.
1
[32]
Mv
Receptors covered by bound VLDL.
2
[15]
P
Number of receptors per pit.
180
[15]
f
Fraction of receptors recycled.
0.7
[36]
R chol
L
Average cholesterol content per LDL.
3400
[37]
R chol
v
Average cholesterol content per VLDL.
3100
[17]
J
Nucleus to cell ratio.
0.1
[16]
W
Cell medium to cell volume ratio.
1.50 × 10 3
[15]
xc
Molec. of cholesterol to inactivate SREBP-2.
4
[12]
x h
Number of binding sites for SREBP-2 on HMGCR gene.
3
[12]
89
2.4. Parameter Estimation
We have utilised parameterisations detailed in [10,15] to inform each of the models, respectively.
Table 1 details each dimensional parameter, their value and source. Non-dimensional parameter values
and their definitions (in terms of dimensional ones) are given in Table 2.
In the case of the additional reactions involving LDLR synthesis (LDLR transcription, translation,
mRNA degradation and the dissociation of SREBP-2 for the LDLR gene) these were determined in
a similar manner to that detailed in [10] with further details provided in Appendix B. The rates of
VLDL and LDL delipidation and the source of extracellular VLDL were calculated as also shown in
Appendix B.
Initially the integrated model was informed with the parameter values detailed in [10,15] and
derived in Appendix B. A local sensitivity analysis was then used to determine which parameters
required variation such that the integrated model reproduced known intracellular cholesterol
concentrations [12]. Where adjustments to parameter values determined in [10,15] where made,
this is detailed in Table 1 (denoted “This study" along with either the citing of [10,15]) and Appendix B.
Table 1. Dimensional model parameters. Molec. denotes molecules, r receptors and conc. concentration.
Parameter
Description
Dimensional Value
Units
Reference
μ ∗
mh
Rate of HMGCR mRNA transcription.
5.17 × 10 5
molec.
mL s
[19,20]
μ ∗
mr
Rate of receptor mRNA transcription.
4.56 × 10 6
molec.
mL s
[19,21]
μ h
Rate of HMGCR translation.
3.32 × 10 −2
1
s
[20,22]
μ c
Rate of cholesterol production.
2.16 × 10 3
1
s
[23–25]
μ r
Rate of receptor translation.
5.10 × 10 −1
1
s
[26]
δ mh
Rate of HMGCR mRNA degradation.
4.48 × 10 −5
1
s
[27]
δmr
Rate of receptor mRNA degradation.
4.48 × 10 −5
1
s
[28]
δ h
Rate of HMGCR degradation.
6.42 × 10 −5
1
s
[29]
δc
Rate of cholesterol degradation.
1.20 × 10 −4
1
s
This study.
κ mh
SREBP-HMGCR gene binding affinity.
8.21 × 10 16
molec.
mL
This study.
κc
Cholesterol-SREBP-2 dissociation constant.
8.91 × 10 18
molec.
mL
This study.
κmr
LDLR gene-SREBP-2 dissociation constant.
8.21 × 10 16
molec.
mL
This study.
α L
Rate of LDL-receptor binding.
6.66 × 10 −17
mL
rs
[30]
α −L
Rate of LDL-receptor unbinding.
5.90 × 10 −4
1
s
[30]
αv
Rate of VLDL-receptor binding.
9.32 × 10 −16
mL
rs
[15,17,31]
α−v
Rate of VLDL-receptor unbinding.
2.95 × 10 −4
1
s
[15,17]
β L
Rate of LDL internalisation.
2.70 × 10 −3
1
s
[30,32,33]
β v
Rate of VLDL internalisation.
2.70 × 10 −3
1
s
[15]
β 0
Rate of free receptor internalisation.
0
mL (P−1)
r (P−1) s
[34]
γ L
Rate of LDL to cholesterol conversion.
3.33 × 10 −3
1
s
[33]
γ v
Rate of VLDL to cholesterol conversion.
3.33 × 10 −3
1
s
[15]
γ r
Rate of receptor recycling.
1.00 × 10 −2
1
s
[30]
χ v
Rate of VLDL-LDL delipidation.
8.7 × 10 −6
1
s
[35]
M l
Receptors covered by bound LDL.
1
[32]
Mv
Receptors covered by bound VLDL.
2
[15]
P
Number of receptors per pit.
180
[15]
f
Fraction of receptors recycled.
0.7
[36]
R chol
L
Average cholesterol content per LDL.
3400
[37]
R chol
v
Average cholesterol content per VLDL.
3100
[17]
J
Nucleus to cell ratio.
0.1
[16]
W
Cell medium to cell volume ratio.
1.50 × 10 3
[15]
xc
Molec. of cholesterol to inactivate SREBP-2.
4
[12]
x h
Number of binding sites for SREBP-2 on HMGCR gene.
3
[12]
89