

Processes 2019, 7,97
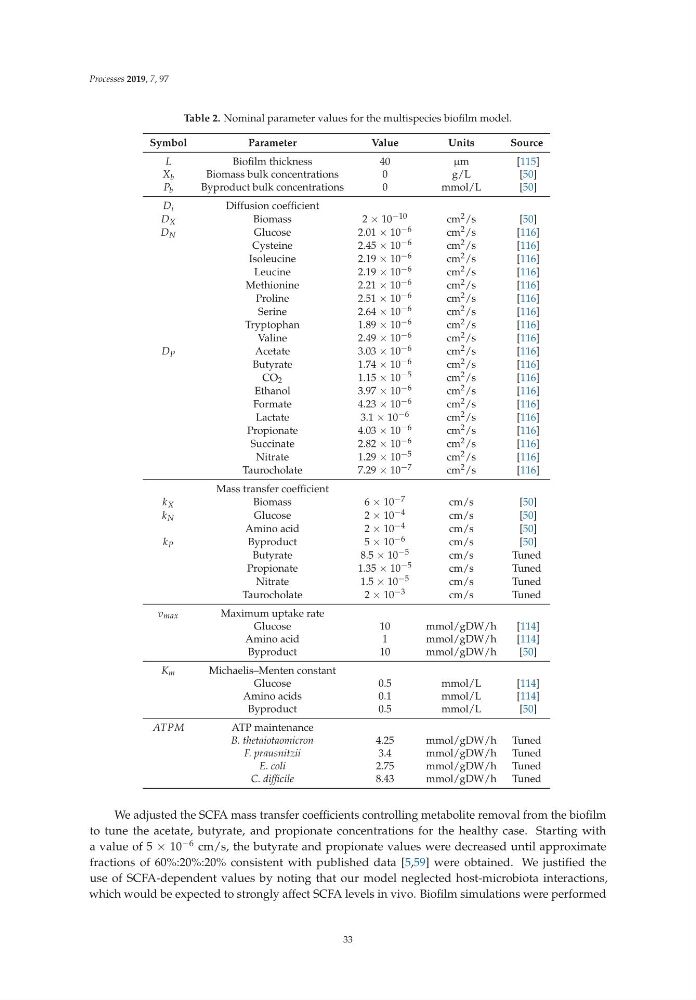
Table 2. Nominal parameter values for the multispecies biofilm model.
Symbol
Parameter
Value
Units
Source
L
Biofilm thickness
40
µm[ 115]
X b
Biomass bulk concentrations
0
g/L
[50]
P b
Byproduct bulk concentrations
0
mmol/L
[50]
D i
Diffusion coefficient
D X
Biomass
2 × 10 −10
cm 2 /s
[50]
D N
Glucose
2.01 × 10 −6
cm 2 /s
[116]
Cysteine
2.45 × 10 −6
cm 2 /s
[116]
Isoleucine
2.19 × 10 −6
cm 2 /s
[116]
Leucine
2.19 × 10 −6
cm 2 /s
[116]
Methionine
2.21 × 10 −6
cm 2 /s
[116]
Proline
2.51 × 10 −6
cm 2 /s
[116]
Serine
2.64 × 10 −6
cm 2 /s
[116]
Tryptophan
1.89 × 10 −6
cm 2 /s
[116]
Valine
2.49 × 10 −6
cm 2 /s
[116]
D P
Acetate
3.03 × 10 −6
cm 2 /s
[116]
Butyrate
1.74 × 10 −6
cm 2 /s
[116]
CO 2
1.15 × 10 −5
cm 2 /s
[116]
Ethanol
3.97 × 10 −6
cm 2 /s
[116]
Formate
4.23 × 10 −6
cm 2 /s
[116]
Lactate
3.1 × 10 −6
cm 2 /s
[116]
Propionate
4.03 × 10 −6
cm 2 /s
[116]
Succinate
2.82 × 10 −6
cm 2 /s
[116]
Nitrate
1.29 × 10 −5
cm 2 /s
[116]
Taurocholate
7.29 × 10 −7
cm 2 /s
[116]
Mass transfer coefficient
k X
Biomass
6 × 10 −7
cm/s
[50]
k N
Glucose
2 × 10 −4
cm/s
[50]
Amino acid
2 × 10 −4
cm/s
[50]
k P
Byproduct
5 × 10 −6
cm/s
[50]
Butyrate
8.5 × 10 −5
cm/s
Tuned
Propionate
1.35 × 10 −5
cm/s
Tuned
Nitrate
1.5 × 10 −5
cm/s
Tuned
Taurocholate
2 × 10 −3
cm/s
Tuned
v max
Maximum uptake rate
Glucose
10
mmol/gDW/h
[114]
Amino acid
1
mmol/gDW/h
[114]
Byproduct
10
mmol/gDW/h
[50]
K m
Michaelis–Menten constant
Glucose
0.5
mmol/L
[114]
Amino acids
0.1
mmol/L
[114]
Byproduct
0.5
mmol/L
[50]
ATPM
ATP maintenance
B. thetaiotaomicron
4.25
mmol/gDW/h Tuned
F. prausnitzii
3.4
mmol/gDW/h Tuned
E. coli
2.75
mmol/gDW/h Tuned
C. difficile
8.43
mmol/gDW/h Tuned
We adjusted the SCFA mass transfer coefficients controlling metabolite removal from the biofilm
to tune the acetate, butyrate, and propionate concentrations for the healthy case. Starting with
a value of 5 × 10 −6 cm/s, the butyrate and propionate values were decreased until approximate
fractions of 60%:20%:20% consistent with published data [5,59] were obtained. We justified the
use of SCFA-dependent values by noting that our model neglected host-microbiota interactions,
which would be expected to strongly affect SCFA levels in vivo. Biofilm simulations were performed
33
Table 2. Nominal parameter values for the multispecies biofilm model.
Symbol
Parameter
Value
Units
Source
L
Biofilm thickness
40
µm[ 115]
X b
Biomass bulk concentrations
0
g/L
[50]
P b
Byproduct bulk concentrations
0
mmol/L
[50]
D i
Diffusion coefficient
D X
Biomass
2 × 10 −10
cm 2 /s
[50]
D N
Glucose
2.01 × 10 −6
cm 2 /s
[116]
Cysteine
2.45 × 10 −6
cm 2 /s
[116]
Isoleucine
2.19 × 10 −6
cm 2 /s
[116]
Leucine
2.19 × 10 −6
cm 2 /s
[116]
Methionine
2.21 × 10 −6
cm 2 /s
[116]
Proline
2.51 × 10 −6
cm 2 /s
[116]
Serine
2.64 × 10 −6
cm 2 /s
[116]
Tryptophan
1.89 × 10 −6
cm 2 /s
[116]
Valine
2.49 × 10 −6
cm 2 /s
[116]
D P
Acetate
3.03 × 10 −6
cm 2 /s
[116]
Butyrate
1.74 × 10 −6
cm 2 /s
[116]
CO 2
1.15 × 10 −5
cm 2 /s
[116]
Ethanol
3.97 × 10 −6
cm 2 /s
[116]
Formate
4.23 × 10 −6
cm 2 /s
[116]
Lactate
3.1 × 10 −6
cm 2 /s
[116]
Propionate
4.03 × 10 −6
cm 2 /s
[116]
Succinate
2.82 × 10 −6
cm 2 /s
[116]
Nitrate
1.29 × 10 −5
cm 2 /s
[116]
Taurocholate
7.29 × 10 −7
cm 2 /s
[116]
Mass transfer coefficient
k X
Biomass
6 × 10 −7
cm/s
[50]
k N
Glucose
2 × 10 −4
cm/s
[50]
Amino acid
2 × 10 −4
cm/s
[50]
k P
Byproduct
5 × 10 −6
cm/s
[50]
Butyrate
8.5 × 10 −5
cm/s
Tuned
Propionate
1.35 × 10 −5
cm/s
Tuned
Nitrate
1.5 × 10 −5
cm/s
Tuned
Taurocholate
2 × 10 −3
cm/s
Tuned
v max
Maximum uptake rate
Glucose
10
mmol/gDW/h
[114]
Amino acid
1
mmol/gDW/h
[114]
Byproduct
10
mmol/gDW/h
[50]
K m
Michaelis–Menten constant
Glucose
0.5
mmol/L
[114]
Amino acids
0.1
mmol/L
[114]
Byproduct
0.5
mmol/L
[50]
ATPM
ATP maintenance
B. thetaiotaomicron
4.25
mmol/gDW/h Tuned
F. prausnitzii
3.4
mmol/gDW/h Tuned
E. coli
2.75
mmol/gDW/h Tuned
C. difficile
8.43
mmol/gDW/h Tuned
We adjusted the SCFA mass transfer coefficients controlling metabolite removal from the biofilm
to tune the acetate, butyrate, and propionate concentrations for the healthy case. Starting with
a value of 5 × 10 −6 cm/s, the butyrate and propionate values were decreased until approximate
fractions of 60%:20%:20% consistent with published data [5,59] were obtained. We justified the
use of SCFA-dependent values by noting that our model neglected host-microbiota interactions,
which would be expected to strongly affect SCFA levels in vivo. Biofilm simulations were performed
33