

Processes 2018, 6,38
(4) Sequentially add chloroform (0.75 mL) and water (0.75 mL), vortexing 10–15 s after each addition.
(5) Centrifuge (4000 rpm, 15 min, 20 ◦ C).
(6) Transfer the lower chloroform phase, which contains the lipids, via micropipette to a pre-weighed
aluminum pan.
(7) Evaporate the chloroform in a fume hood and weigh after 12, 24, and 36 h to confirm
complete evaporation.
Notes: Weights were measured with a Mettler Toledo MT5 microbalance with accuracy to 0.001 mg
and were recorded as an average of three measurements. A blank reaction containing 0.6 mL water
was also performed as a control.
6.3. Test Results
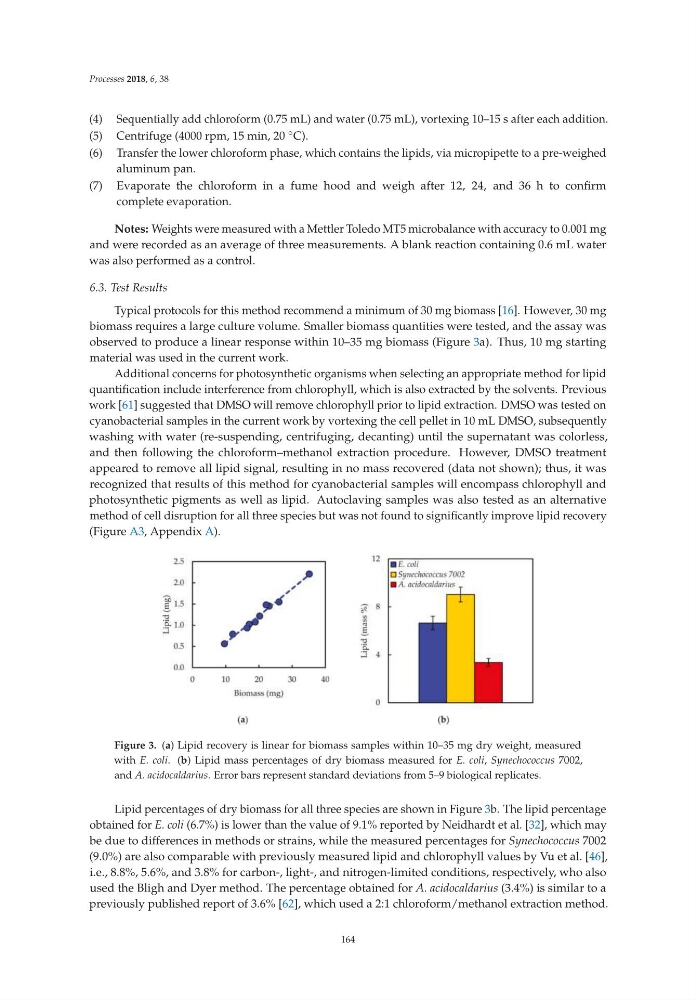
Typical protocols for this method recommend a minimum of 30 mg biomass [16]. However, 30 mg
biomass requires a large culture volume. Smaller biomass quantities were tested, and the assay was
observed to produce a linear response within 10–35 mg biomass (Figure 3a). Thus, 10 mg starting
material was used in the current work.
Additional concerns for photosynthetic organisms when selecting an appropriate method for lipid
quantification include interference from chlorophyll, which is also extracted by the solvents. Previous
work [61] suggested that DMSO will remove chlorophyll prior to lipid extraction. DMSO was tested on
cyanobacterial samples in the current work by vortexing the cell pellet in 10 mL DMSO, subsequently
washing with water (re-suspending, centrifuging, decanting) until the supernatant was colorless,
and then following the chloroform–methanol extraction procedure. However, DMSO treatment
appeared to remove all lipid signal, resulting in no mass recovered (data not shown); thus, it was
recognized that results of this method for cyanobacterial samples will encompass chlorophyll and
photosynthetic pigments as well as lipid. Autoclaving samples was also tested as an alternative
method of cell disruption for all three species but was not found to significantly improve lipid recovery
(Figure A3, Appendix A).
Figure 3. (a) Lipid recovery is linear for biomass samples within 10–35 mg dry weight, measured
with E. coli.( b) Lipid mass percentages of dry biomass measured for E. coli, Synechococcus 7002,
and A. acidocaldarius. Error bars represent standard deviations from 5–9 biological replicates.
Lipid percentages of dry biomass for all three species are shown in Figure 3b. The lipid percentage
obtained for E. coli (6.7%) is lower than the value of 9.1% reported by Neidhardt et al. [32], which may
be due to differences in methods or strains, while the measured percentages for Synechococcus 7002
(9.0%) are also comparable with previously measured lipid and chlorophyll values by Vu et al. [46],
i.e., 8.8%, 5.6%, and 3.8% for carbon-, light-, and nitrogen-limited conditions, respectively, who also
used the Bligh and Dyer method. The percentage obtained for A. acidocaldarius (3.4%) is similar to a
previously published report of 3.6% [62], which used a 2:1 chloroform/methanol extraction method.
164
(4) Sequentially add chloroform (0.75 mL) and water (0.75 mL), vortexing 10–15 s after each addition.
(5) Centrifuge (4000 rpm, 15 min, 20 ◦ C).
(6) Transfer the lower chloroform phase, which contains the lipids, via micropipette to a pre-weighed
aluminum pan.
(7) Evaporate the chloroform in a fume hood and weigh after 12, 24, and 36 h to confirm
complete evaporation.
Notes: Weights were measured with a Mettler Toledo MT5 microbalance with accuracy to 0.001 mg
and were recorded as an average of three measurements. A blank reaction containing 0.6 mL water
was also performed as a control.
6.3. Test Results
Typical protocols for this method recommend a minimum of 30 mg biomass [16]. However, 30 mg
biomass requires a large culture volume. Smaller biomass quantities were tested, and the assay was
observed to produce a linear response within 10–35 mg biomass (Figure 3a). Thus, 10 mg starting
material was used in the current work.
Additional concerns for photosynthetic organisms when selecting an appropriate method for lipid
quantification include interference from chlorophyll, which is also extracted by the solvents. Previous
work [61] suggested that DMSO will remove chlorophyll prior to lipid extraction. DMSO was tested on
cyanobacterial samples in the current work by vortexing the cell pellet in 10 mL DMSO, subsequently
washing with water (re-suspending, centrifuging, decanting) until the supernatant was colorless,
and then following the chloroform–methanol extraction procedure. However, DMSO treatment
appeared to remove all lipid signal, resulting in no mass recovered (data not shown); thus, it was
recognized that results of this method for cyanobacterial samples will encompass chlorophyll and
photosynthetic pigments as well as lipid. Autoclaving samples was also tested as an alternative
method of cell disruption for all three species but was not found to significantly improve lipid recovery
(Figure A3, Appendix A).
Figure 3. (a) Lipid recovery is linear for biomass samples within 10–35 mg dry weight, measured
with E. coli.( b) Lipid mass percentages of dry biomass measured for E. coli, Synechococcus 7002,
and A. acidocaldarius. Error bars represent standard deviations from 5–9 biological replicates.
Lipid percentages of dry biomass for all three species are shown in Figure 3b. The lipid percentage
obtained for E. coli (6.7%) is lower than the value of 9.1% reported by Neidhardt et al. [32], which may
be due to differences in methods or strains, while the measured percentages for Synechococcus 7002
(9.0%) are also comparable with previously measured lipid and chlorophyll values by Vu et al. [46],
i.e., 8.8%, 5.6%, and 3.8% for carbon-, light-, and nitrogen-limited conditions, respectively, who also
used the Bligh and Dyer method. The percentage obtained for A. acidocaldarius (3.4%) is similar to a
previously published report of 3.6% [62], which used a 2:1 chloroform/methanol extraction method.
164