

Processes 2018, 6,38
(9) Place on ice for 5–10 min until cool, vortex briefly, and measure absorbance at 625 nm (Genesys
6 spectrophotometer).
Notes: Use a neutral reaction (containing no glucose) as the blank. Perform a standard curve with
each assay, and treat standards identically to samples with anthrone reagent. Different sources report
slightly varying absorbance wavelengths and water bath incubation times; the most widely supported
parameters were implemented in the current work.
4.2.3. Quantification of Hexoses Excluding Glycogen
Collect the methanol decanted after the precipitation and wash steps (Steps 4–5) in an aluminum
pan and evaporate in a fume hood. The methanol contains non-glycogen hexoses, which did not
adsorb to and precipitate with sodium sulfate. Re-suspend in 1 mL water, transfer to a clean glass test
tube, and place on ice to chill (Step 6); then perform the anthrone reaction as in Steps 7–9.
4.2.4. Quantification of Total Carbohydrate
Skip the glycogen precipitation and wash steps (Steps 1–5). Re-suspend the cell pellet in 1 mL
water, transfer to a clean glass test tube, and place on ice to chill (Step 6). Then, perform the anthrone
reaction as in Steps 7–9.
4.3. Test Results
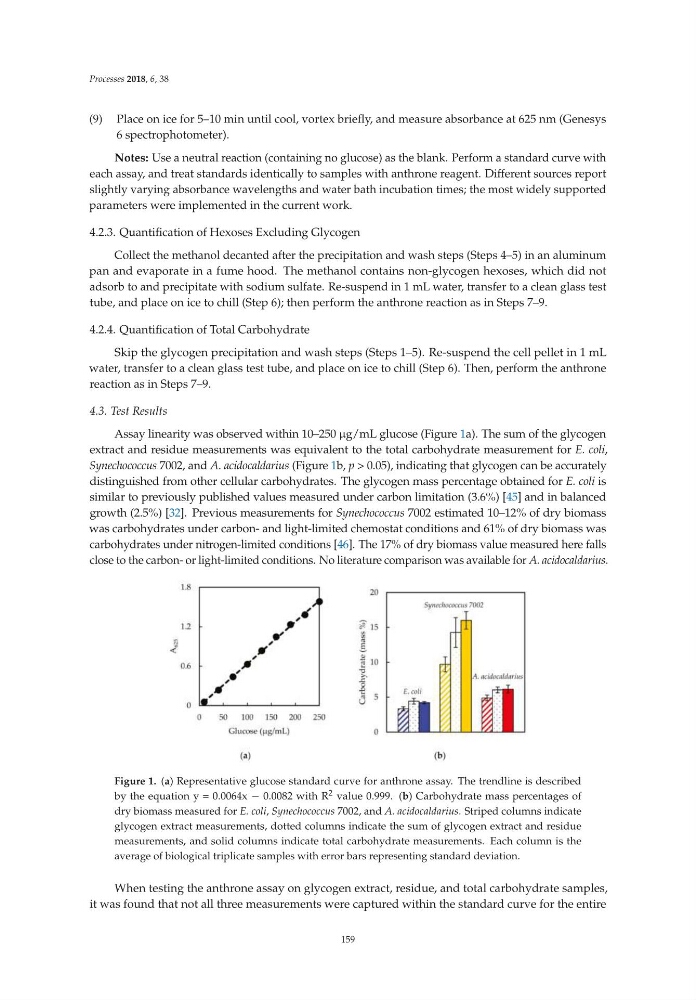
Assay linearity was observed within 10–250 µg/mL glucose (Figure 1a). The sum of the glycogen
extract and residue measurements was equivalent to the total carbohydrate measurement for E. coli,
Synechococcus 7002, and A. acidocaldarius (Figure 1b, p > 0.05), indicating that glycogen can be accurately
distinguished from other cellular carbohydrates. The glycogen mass percentage obtained for E. coli is
similar to previously published values measured under carbon limitation (3.6%) [45] and in balanced
growth (2.5%) [32]. Previous measurements for Synechococcus 7002 estimated 10–12% of dry biomass
was carbohydrates under carbon- and light-limited chemostat conditions and 61% of dry biomass was
carbohydrates under nitrogen-limited conditions [46]. The 17% of dry biomass value measured here falls
close to the carbon- or light-limited conditions. No literature comparison was available for A. acidocaldarius.
Figure 1. (a) Representative glucose standard curve for anthrone assay. The trendline is described
by the equation y = 0.0064x − 0.0082 with R 2 value 0.999. (b) Carbohydrate mass percentages of
dry biomass measured for E. coli, Synechococcus 7002, and A. acidocaldarius. Striped columns indicate
glycogen extract measurements, dotted columns indicate the sum of glycogen extract and residue
measurements, and solid columns indicate total carbohydrate measurements. Each column is the
average of biological triplicate samples with error bars representing standard deviation.
When testing the anthrone assay on glycogen extract, residue, and total carbohydrate samples,
it was found that not all three measurements were captured within the standard curve for the entire
159
(9) Place on ice for 5–10 min until cool, vortex briefly, and measure absorbance at 625 nm (Genesys
6 spectrophotometer).
Notes: Use a neutral reaction (containing no glucose) as the blank. Perform a standard curve with
each assay, and treat standards identically to samples with anthrone reagent. Different sources report
slightly varying absorbance wavelengths and water bath incubation times; the most widely supported
parameters were implemented in the current work.
4.2.3. Quantification of Hexoses Excluding Glycogen
Collect the methanol decanted after the precipitation and wash steps (Steps 4–5) in an aluminum
pan and evaporate in a fume hood. The methanol contains non-glycogen hexoses, which did not
adsorb to and precipitate with sodium sulfate. Re-suspend in 1 mL water, transfer to a clean glass test
tube, and place on ice to chill (Step 6); then perform the anthrone reaction as in Steps 7–9.
4.2.4. Quantification of Total Carbohydrate
Skip the glycogen precipitation and wash steps (Steps 1–5). Re-suspend the cell pellet in 1 mL
water, transfer to a clean glass test tube, and place on ice to chill (Step 6). Then, perform the anthrone
reaction as in Steps 7–9.
4.3. Test Results
Assay linearity was observed within 10–250 µg/mL glucose (Figure 1a). The sum of the glycogen
extract and residue measurements was equivalent to the total carbohydrate measurement for E. coli,
Synechococcus 7002, and A. acidocaldarius (Figure 1b, p > 0.05), indicating that glycogen can be accurately
distinguished from other cellular carbohydrates. The glycogen mass percentage obtained for E. coli is
similar to previously published values measured under carbon limitation (3.6%) [45] and in balanced
growth (2.5%) [32]. Previous measurements for Synechococcus 7002 estimated 10–12% of dry biomass
was carbohydrates under carbon- and light-limited chemostat conditions and 61% of dry biomass was
carbohydrates under nitrogen-limited conditions [46]. The 17% of dry biomass value measured here falls
close to the carbon- or light-limited conditions. No literature comparison was available for A. acidocaldarius.
Figure 1. (a) Representative glucose standard curve for anthrone assay. The trendline is described
by the equation y = 0.0064x − 0.0082 with R 2 value 0.999. (b) Carbohydrate mass percentages of
dry biomass measured for E. coli, Synechococcus 7002, and A. acidocaldarius. Striped columns indicate
glycogen extract measurements, dotted columns indicate the sum of glycogen extract and residue
measurements, and solid columns indicate total carbohydrate measurements. Each column is the
average of biological triplicate samples with error bars representing standard deviation.
When testing the anthrone assay on glycogen extract, residue, and total carbohydrate samples,
it was found that not all three measurements were captured within the standard curve for the entire
159