

63
Cadmium [Cd, 48]
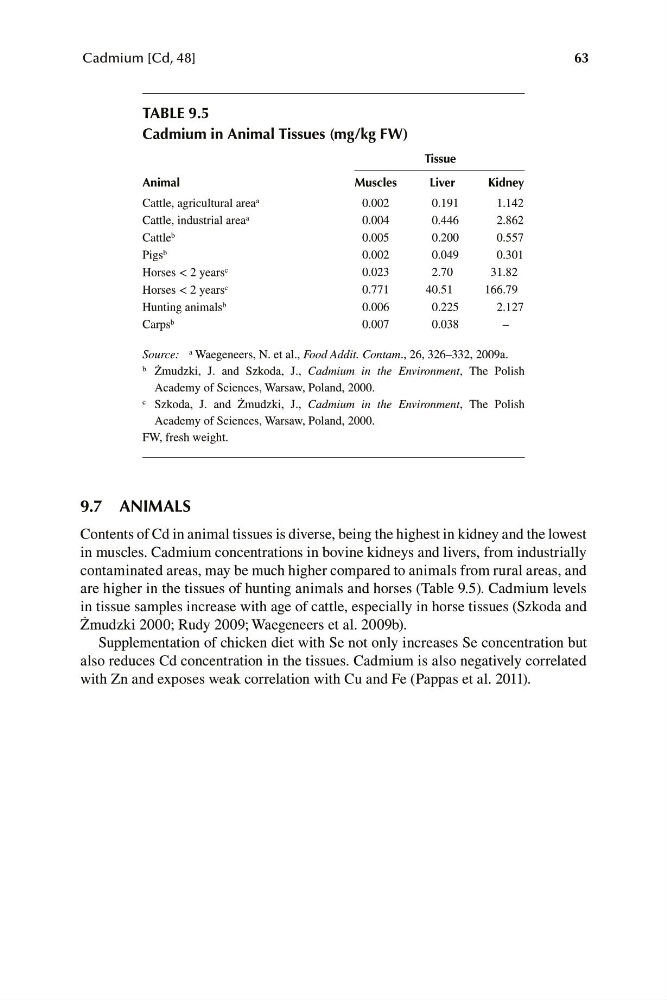
TABLE 9.5
Cadmium in Animal Tissues (mg/kg FW)
Animal
Tissue
Muscles
Liver
Kidney
Cattle, agricultural area a
0.002
0.191
1.142
Cattle, industrial area a
0.004
0.446
2.862
Cattle b
0.005
0.200
0.557
Pigs b
0.002
0.049
0.301
Horses < 2 years c
0.023
2.70
31.82
Horses < 2 years c
0.771
40.51
166.79
Hunting animals b
0.006
0.225
2.127
Carps b
0.007
0.038
–
Source: a Waegeneers, N. et al., Food Addit. Contam., 26, 326–332, 2009a.
b Żmudzki, J. and Szkoda, J., Cadmium in the Environment, The Polish
Academy of Sciences, Warsaw, Poland, 2000.
c Szkoda, J. and Żmudzki, J., Cadmium in the Environment, The Polish
Academy of Sciences, Warsaw, Poland, 2000.
FW, fresh weight.
9.7 ANIMALS
Contents of Cd in animal tissues is diverse, being the highest in kidney and the lowest
in muscles. Cadmium concentrations in bovine kidneys and livers, from industrially
contaminated areas, may be much higher compared to animals from rural areas, and
are higher in the tissues of hunting animals and horses (Table 9.5). Cadmium levels
in tissue samples increase with age of cattle, especially in horse tissues (Szkoda and
Żmudzki 2000; Rudy 2009; Waegeneers et al. 2009b).
Supplementation of chicken diet with Se not only increases Se concentration but
also reduces Cd concentration in the tissues. Cadmium is also negatively correlated
with Zn and exposes weak correlation with Cu and Fe (Pappas et al. 2011).
Cadmium [Cd, 48]
TABLE 9.5
Cadmium in Animal Tissues (mg/kg FW)
Animal
Tissue
Muscles
Liver
Kidney
Cattle, agricultural area a
0.002
0.191
1.142
Cattle, industrial area a
0.004
0.446
2.862
Cattle b
0.005
0.200
0.557
Pigs b
0.002
0.049
0.301
Horses < 2 years c
0.023
2.70
31.82
Horses < 2 years c
0.771
40.51
166.79
Hunting animals b
0.006
0.225
2.127
Carps b
0.007
0.038
–
Source: a Waegeneers, N. et al., Food Addit. Contam., 26, 326–332, 2009a.
b Żmudzki, J. and Szkoda, J., Cadmium in the Environment, The Polish
Academy of Sciences, Warsaw, Poland, 2000.
c Szkoda, J. and Żmudzki, J., Cadmium in the Environment, The Polish
Academy of Sciences, Warsaw, Poland, 2000.
FW, fresh weight.
9.7 ANIMALS
Contents of Cd in animal tissues is diverse, being the highest in kidney and the lowest
in muscles. Cadmium concentrations in bovine kidneys and livers, from industrially
contaminated areas, may be much higher compared to animals from rural areas, and
are higher in the tissues of hunting animals and horses (Table 9.5). Cadmium levels
in tissue samples increase with age of cattle, especially in horse tissues (Szkoda and
Żmudzki 2000; Rudy 2009; Waegeneers et al. 2009b).
Supplementation of chicken diet with Se not only increases Se concentration but
also reduces Cd concentration in the tissues. Cadmium is also negatively correlated
with Zn and exposes weak correlation with Cu and Fe (Pappas et al. 2011).