

62
Trace Elements in Abiotic and Biotic Environments
Authority nominated a PTWI of 2.5 μg/kg bw, to ensure sufficient protection of all
consumers (EFSA 2012a).
Dietary exposure, across European countries, was estimated to be 1.15–7.84 μg/kg
bw/week (EFSA 2012a). Mean, monthly dietary exposures in some countries and
regions of the world was estimated at (in μg/kg bw/month) 2.2 (Australia), 4.6
(United States), and 12 (Japan) (WHO 2011b).
For protecting the health of the consumers and ensuring fair practices in the food
trade. The maximum permissible levels (ML) for Cd (and other contaminants) in certain foodstuffs were set by JECFA and EU (EC 2006; EU 2014) to protect the health
of the consumers and ensure fair practices in the food trade. In dietary exposure
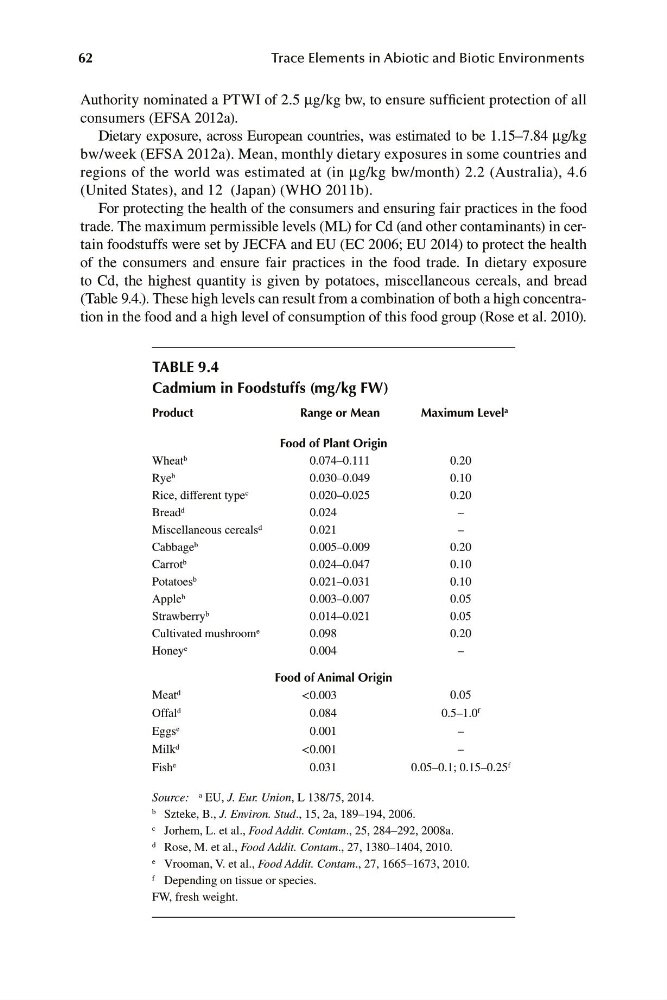
to Cd, the highest quantity is given by potatoes, miscellaneous cereals, and bread
(Table 9.4.). These high levels can result from a combination of both a high concentration in the food and a high level of consumption of this food group (Rose et al. 2010).
TABLE 9.4
Cadmium in Foodstuffs (mg/kg FW)
Product
Range or Mean
Maximum Level a
Food of Plant Origin
Wheat b
0.074–0.111
0.20
Rye b
0.030–0.049
0.10
Rice, different type c
0.020–0.025
0.20
Bread d
0.024
–
Miscellaneous cereals d
0.021
–
Cabbage b
0.005–0.009
0.20
Carrot b
0.024–0.047
0.10
Potatoes b
0.021–0.031
0.10
Apple b
0.003–0.007
0.05
Strawberry b
0.014–0.021
0.05
Cultivated mushroom e
0.098
0.20
Honey e
0.004
–
Food of Animal Origin
Meat d
<0.003
0.05
Offal d
0.084
0.5–1.0 f
Eggs e
0.001
–
Milk d
<0.001
–
Fish e
0.031
0.05–0.1; 0.15–0.25 f
Source: a EU, J. Eur. Union, L 138/75, 2014.
b Szteke, B., J. Environ. Stud., 15, 2a, 189–194, 2006.
c Jorhem, L. et al., Food Addit. Contam., 25, 284–292, 2008a.
d Rose, M. et al., Food Addit. Contam ., 27, 1380–1404, 2010.
e Vrooman, V. et al., Food Addit. Contam., 27, 1665–1673, 2010.
f Depending on tissue or species.
FW, fresh weight.