

Lanthanides
375
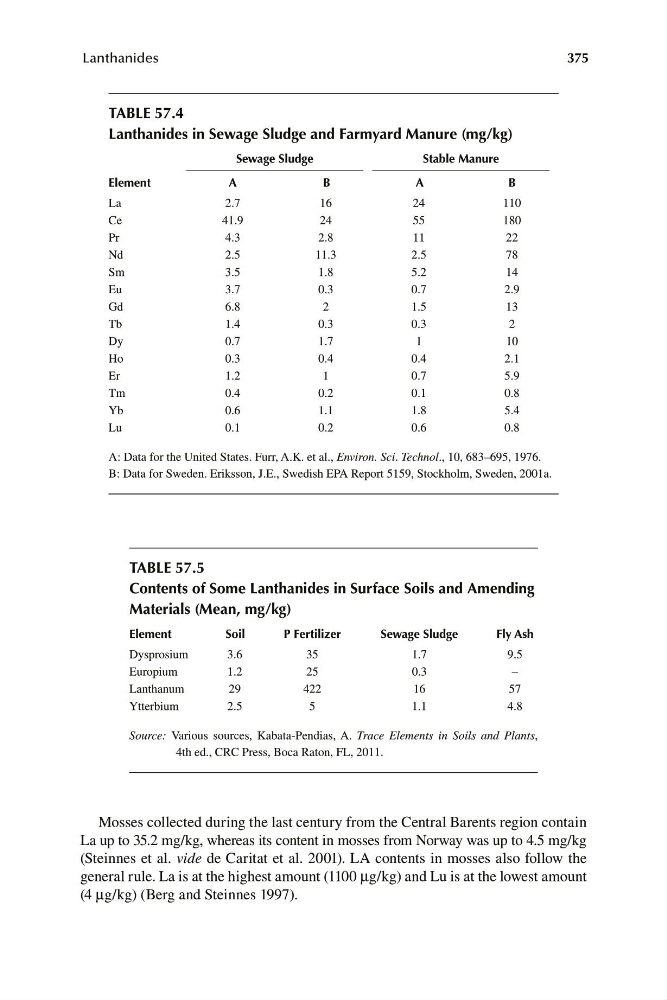
TABLE 57.4
Lanthanides in Sewage Sludge and Farmyard Manure (mg/kg)
Sewage Sludge
Stable Manure
Element
A
B
A
B
La
2.7
16
24
110
Ce
41.9
24
55
180
Pr
4.3
2.8
11
22
Nd
2.5
11.3
2.5
78
Sm
3.5
1.8
5.2
14
Eu
3.7
0.3
0.7
2.9
Gd
6.8
2
1.5
13
Tb
1.4
0.3
0.3
2
Dy
0.7
1.7
1
10
Ho
0.3
0.4
0.4
2.1
Er
1.2
1
0.7
5.9
Tm
0.4
0.2
0.1
0.8
Yb
0.6
1.1
1.8
5.4
Lu
0.1
0.2
0.6
0.8
A: Data for the United States. Furr, A.K. et al., Environ. Sci. Technol., 10, 683–695, 1976.
B: Data for Sweden. Eriksson, J.E., Swedish EPA Report 5159, Stockholm, Sweden, 2001a.
TABLE 57.5
Contents of Some Lanthanides in Surface Soils and Amending
Materials (Mean, mg/kg)
Element
Soil
P Fertilizer
Sewage Sludge
Fly Ash
Dysprosium
Europium
Lanthanum
3.6
1.2
29
35
25
422
1.7
0.3
16
9.5
–
57
Ytterbium
2.5
5
1.1
4.8
Source: Various sources, Kabata-Pendias, A. Trace Elements in Soils and Plants,
4th ed., CRC Press, Boca Raton, FL, 2011.
Mosses collected during the last century from the Central Barents region contain
La up to 35.2 mg/kg, whereas its content in mosses from Norway was up to 4.5 mg/kg
(Steinnes et al. vide de Caritat et al. 2001). LA contents in mosses also follow the
general rule. La is at the highest amount (1100 μg/kg) and Lu is at the lowest amount
(4 μg/kg) (Berg and Steinnes 1997).